
sustAInable
AI-Assisted Collaborative Ideation toolkit for Sustainable Product Development

Master's Thesis
IIT Guwahati (M.Des)
Duration
12 months
My Role
Designing the product and dashboard end-to-end, working closely with Industrial Designers
Contribution
Solo designer and developer with guidance from a Project guide
Maximizing Collaborative Sustainable Design: Phygital Integration for Product Teams
Solving the pain points
sustAInable fundamentally reimagined how sustainability ideation can be collaborative, guided, and data-driven. By merging physical tools with AI and real-time digital feedback, I created a platform that empowers teams to make more sustainable design decisions, with no LCA expertise.


Collaborative Ideation, Real-Time AI Insights
sustAInable unites hands-on card-based ideation with instant AI sustainability analysis. Teams arrange and scan color-coded cards to identify where improvements matter most. As ideas are sketched and rated, the AI provides real-time feedback and visualizes impact, making sustainable design decisions collaborative and data-driven.
.docx
.xlsx
.odt
.pptx
.rtf
.webp
Designing for AI, with AI
AI powered the material analysis, lifecycle assessment, and ideation recommendations, enabling insights no human team could generate alone.


Iterative Design with Rapid Prototyping
Excel-Based Toolkit Limitations
ICS toolkit is a excel only ideation toolkit for sustainable proudct development. It has 3 main phases which are Checklist to evaluate present designs, Eco-Ideaboards for ideation cues and evaluation to rate improvment of ideas.
Limited to a Single-Computer
Lack of Engagement and Flexibility
.webp)
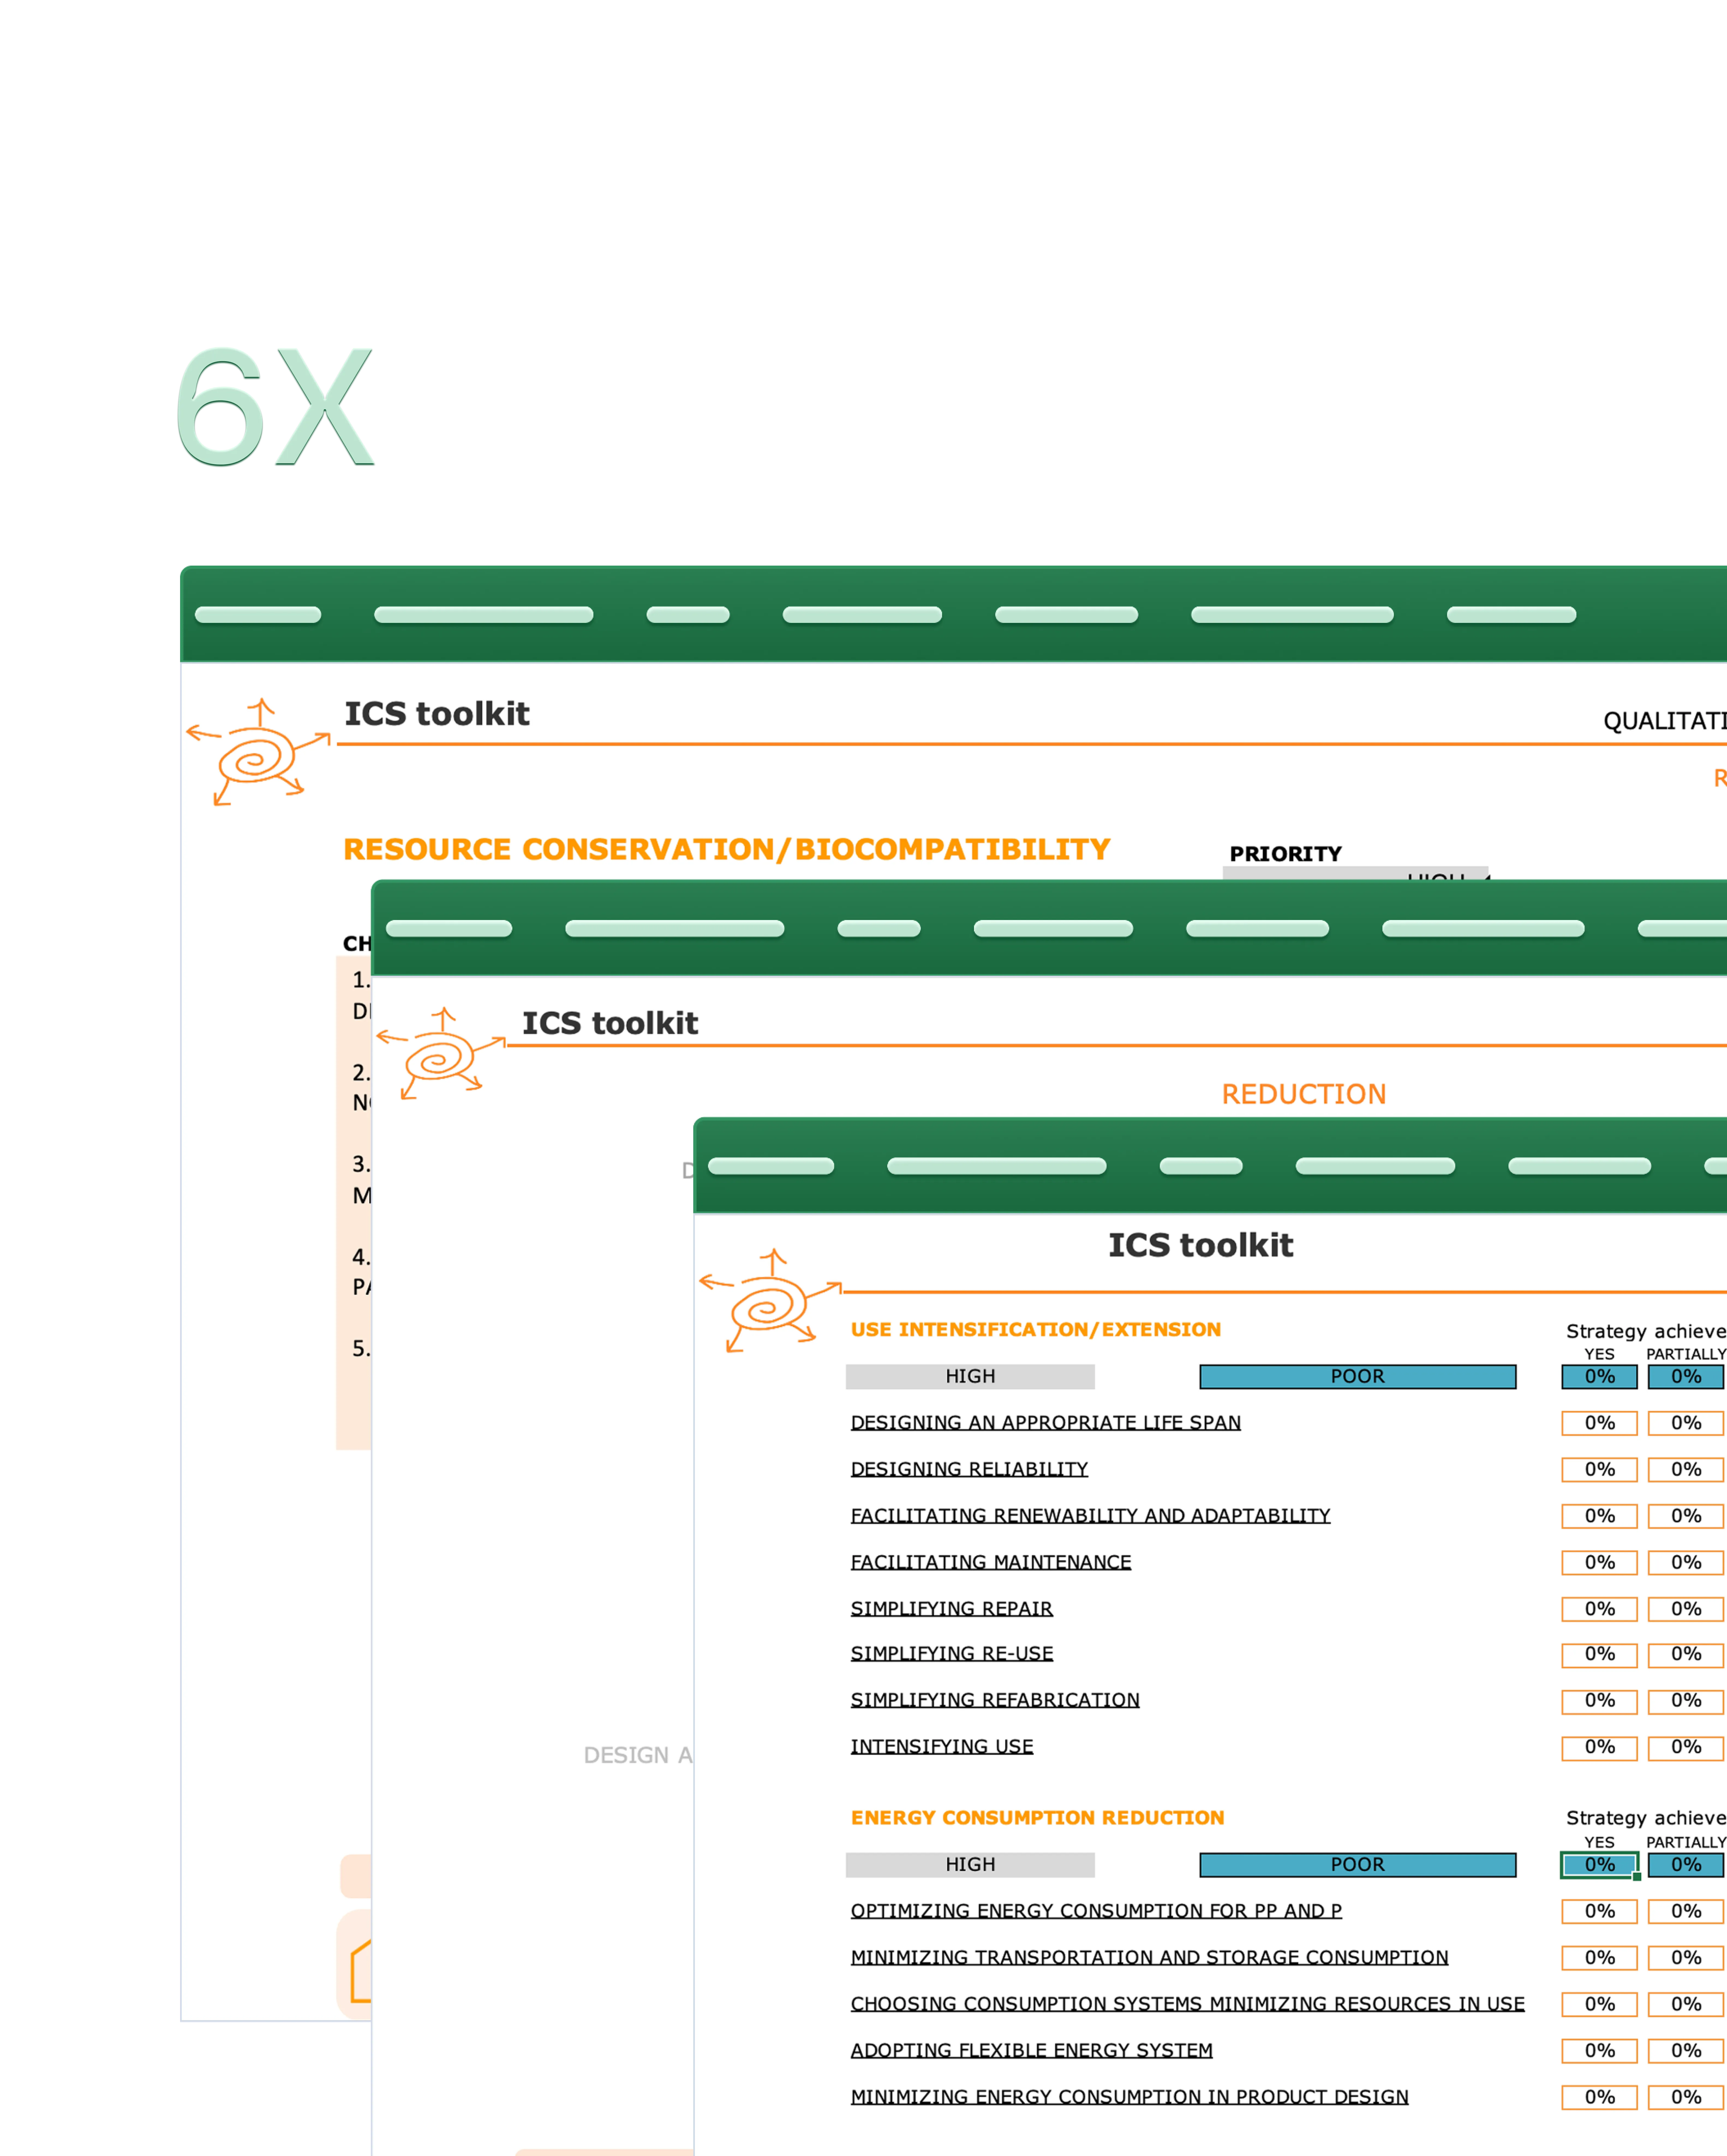
Overload and Complexity
in Evaluation
The whole ICS toolkit has a lot of Ideation cues and assessment question in the checklist, which is a clear overload to finish at a stretch and decision making for which problem to solve for.
There are too many evaluation and assessment questions
The size and structure of the Eco Ideas board cannot be standardized
Self-Evaluated Priority Ratings and Subjectivity
In the product evaluation checklist which which is the 1st step itself the users need to decide which Strategy to solve for which is currently purely on basis of user judgement and prior knowledge.
Priority ratings are based on the user’s own understanding and priorities
The direction and quality of solutions generated are heavily reliant on the creativity and expertise of the user, which can vary widely
.webp)
.webp)
Cascading Effects and Interdependencies
Ideating on the Ideation cues of the Eco ideas board directly or indirectly results in many cascading effects which can prove to e critical resulting in nullification of Design improvments ideated.
The ICS toolkit faces a major challenge in handling the cascading effect, where changes or ideas in one area impact other areas
The direction and quality of solutions generated are heavily reliant on the creativity and expertise of the user, which can vary widely
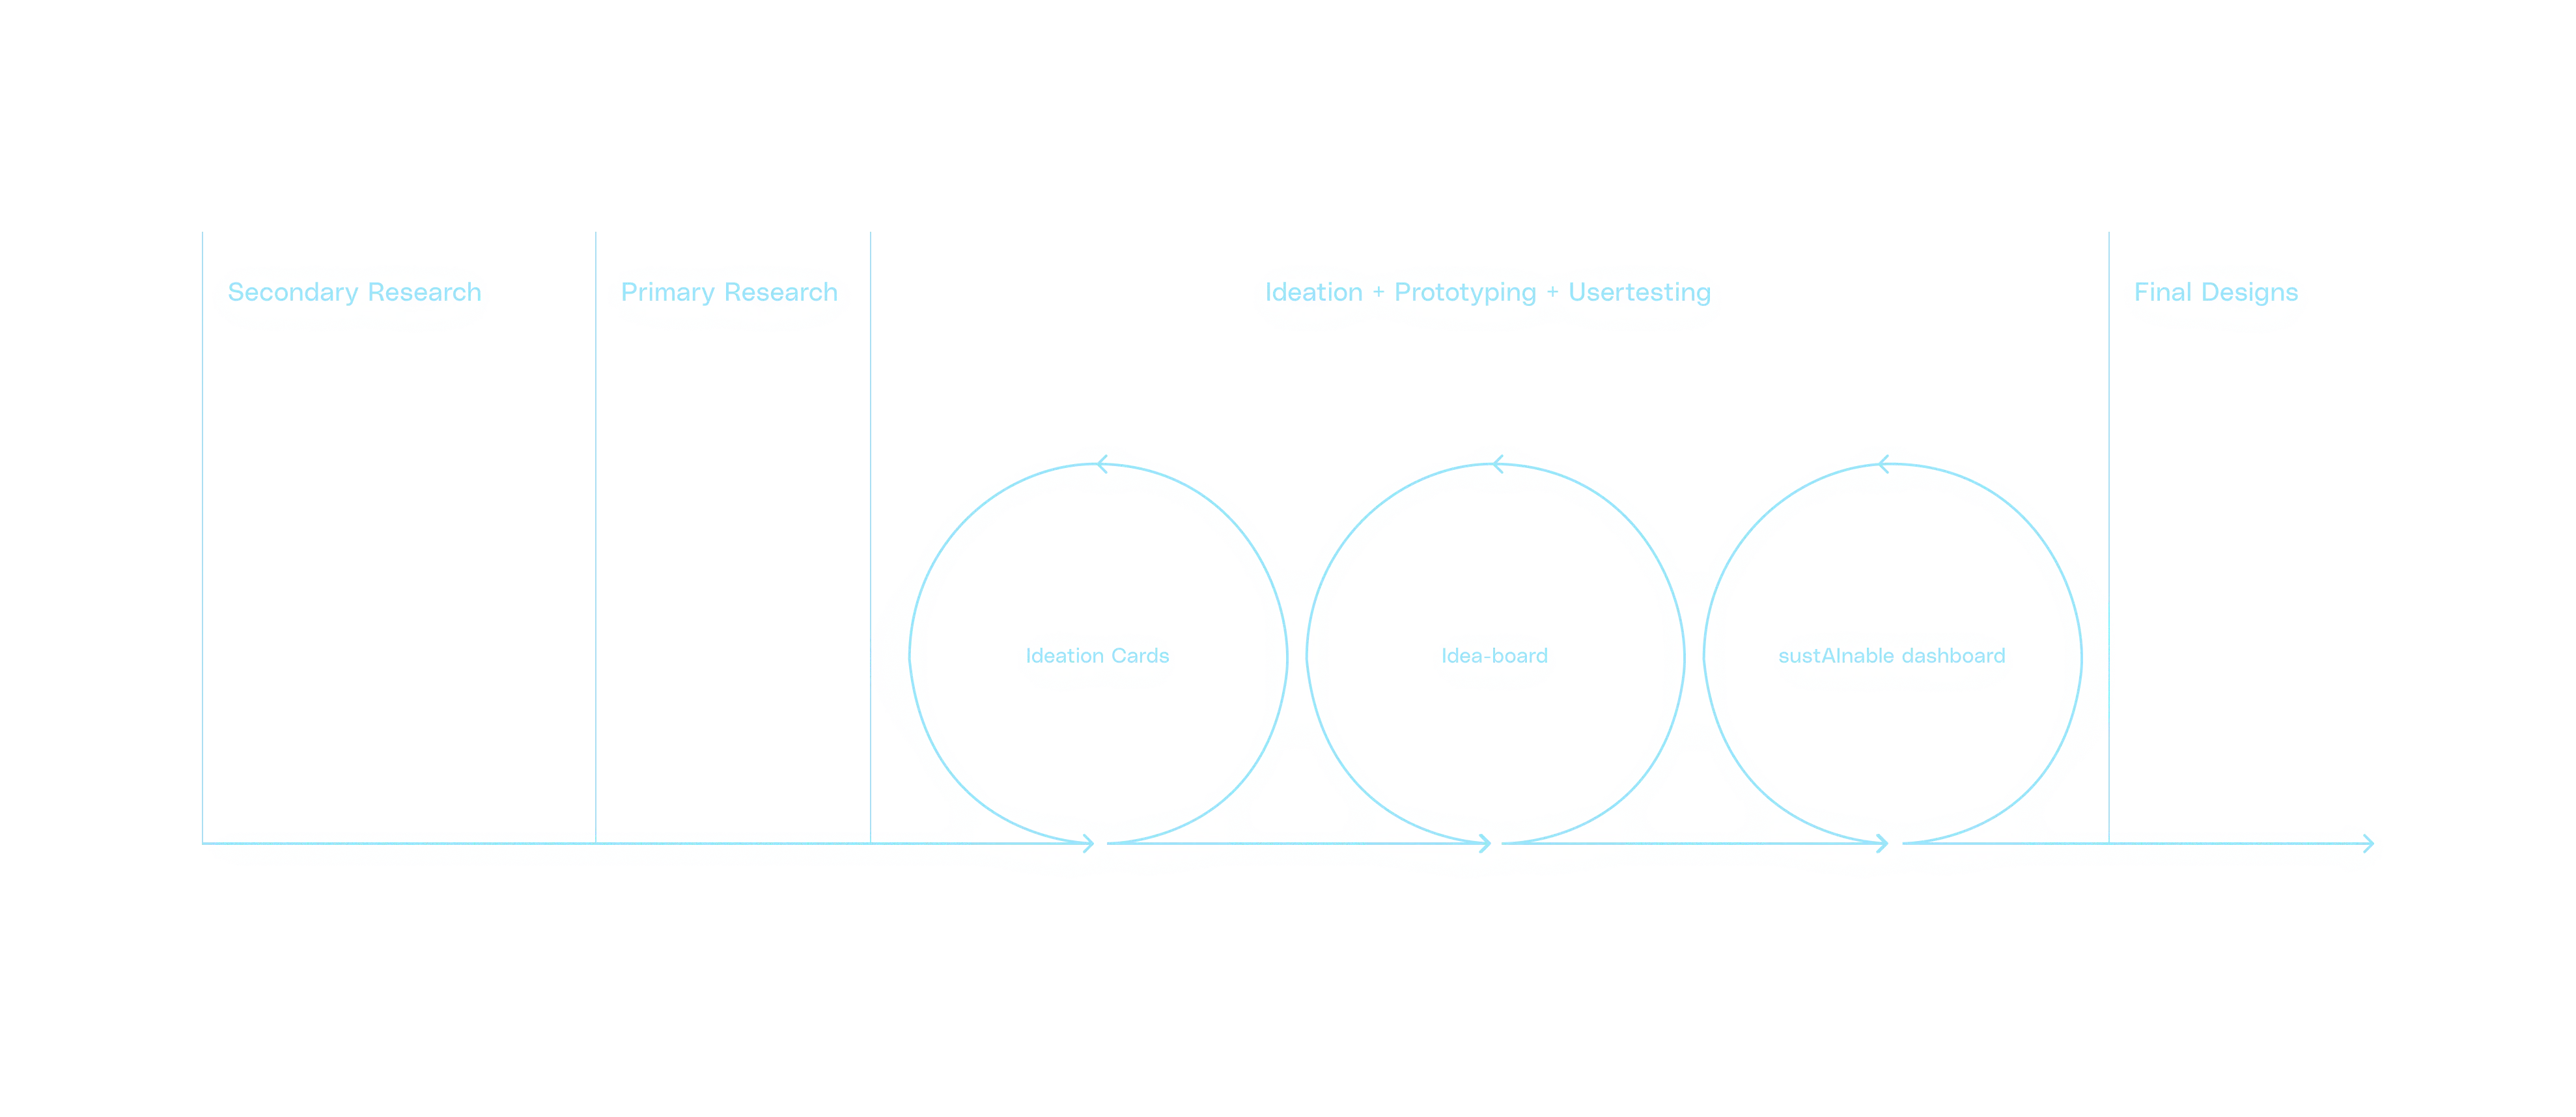
Validating Iterative designs
Testing quick with Target Users
Key Research Focus
- Testing each component and scaling up the ideation toolkit to fit the contenxt better
- Failing fast for quicker ideas to prototyping
- Mental model check on crcuial flows
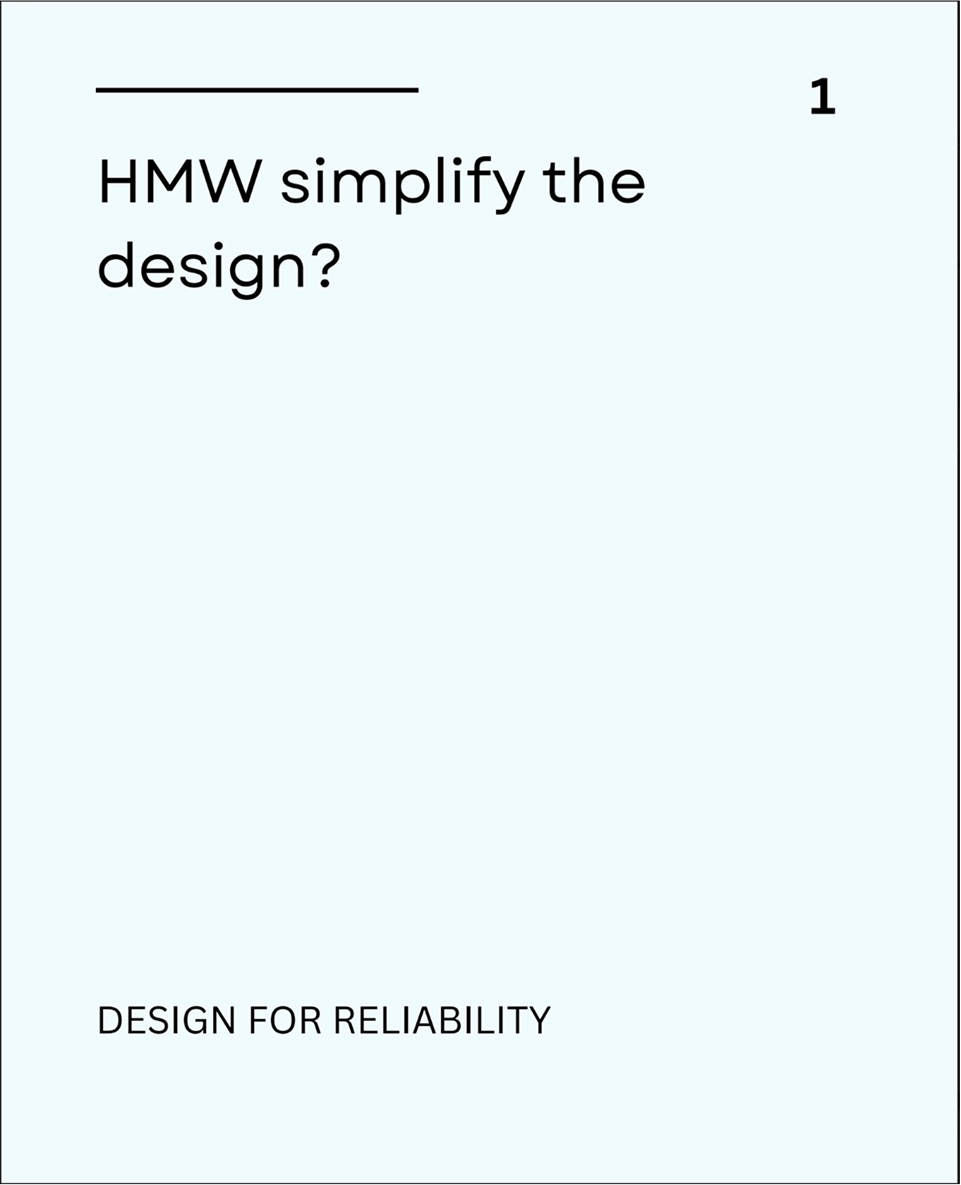
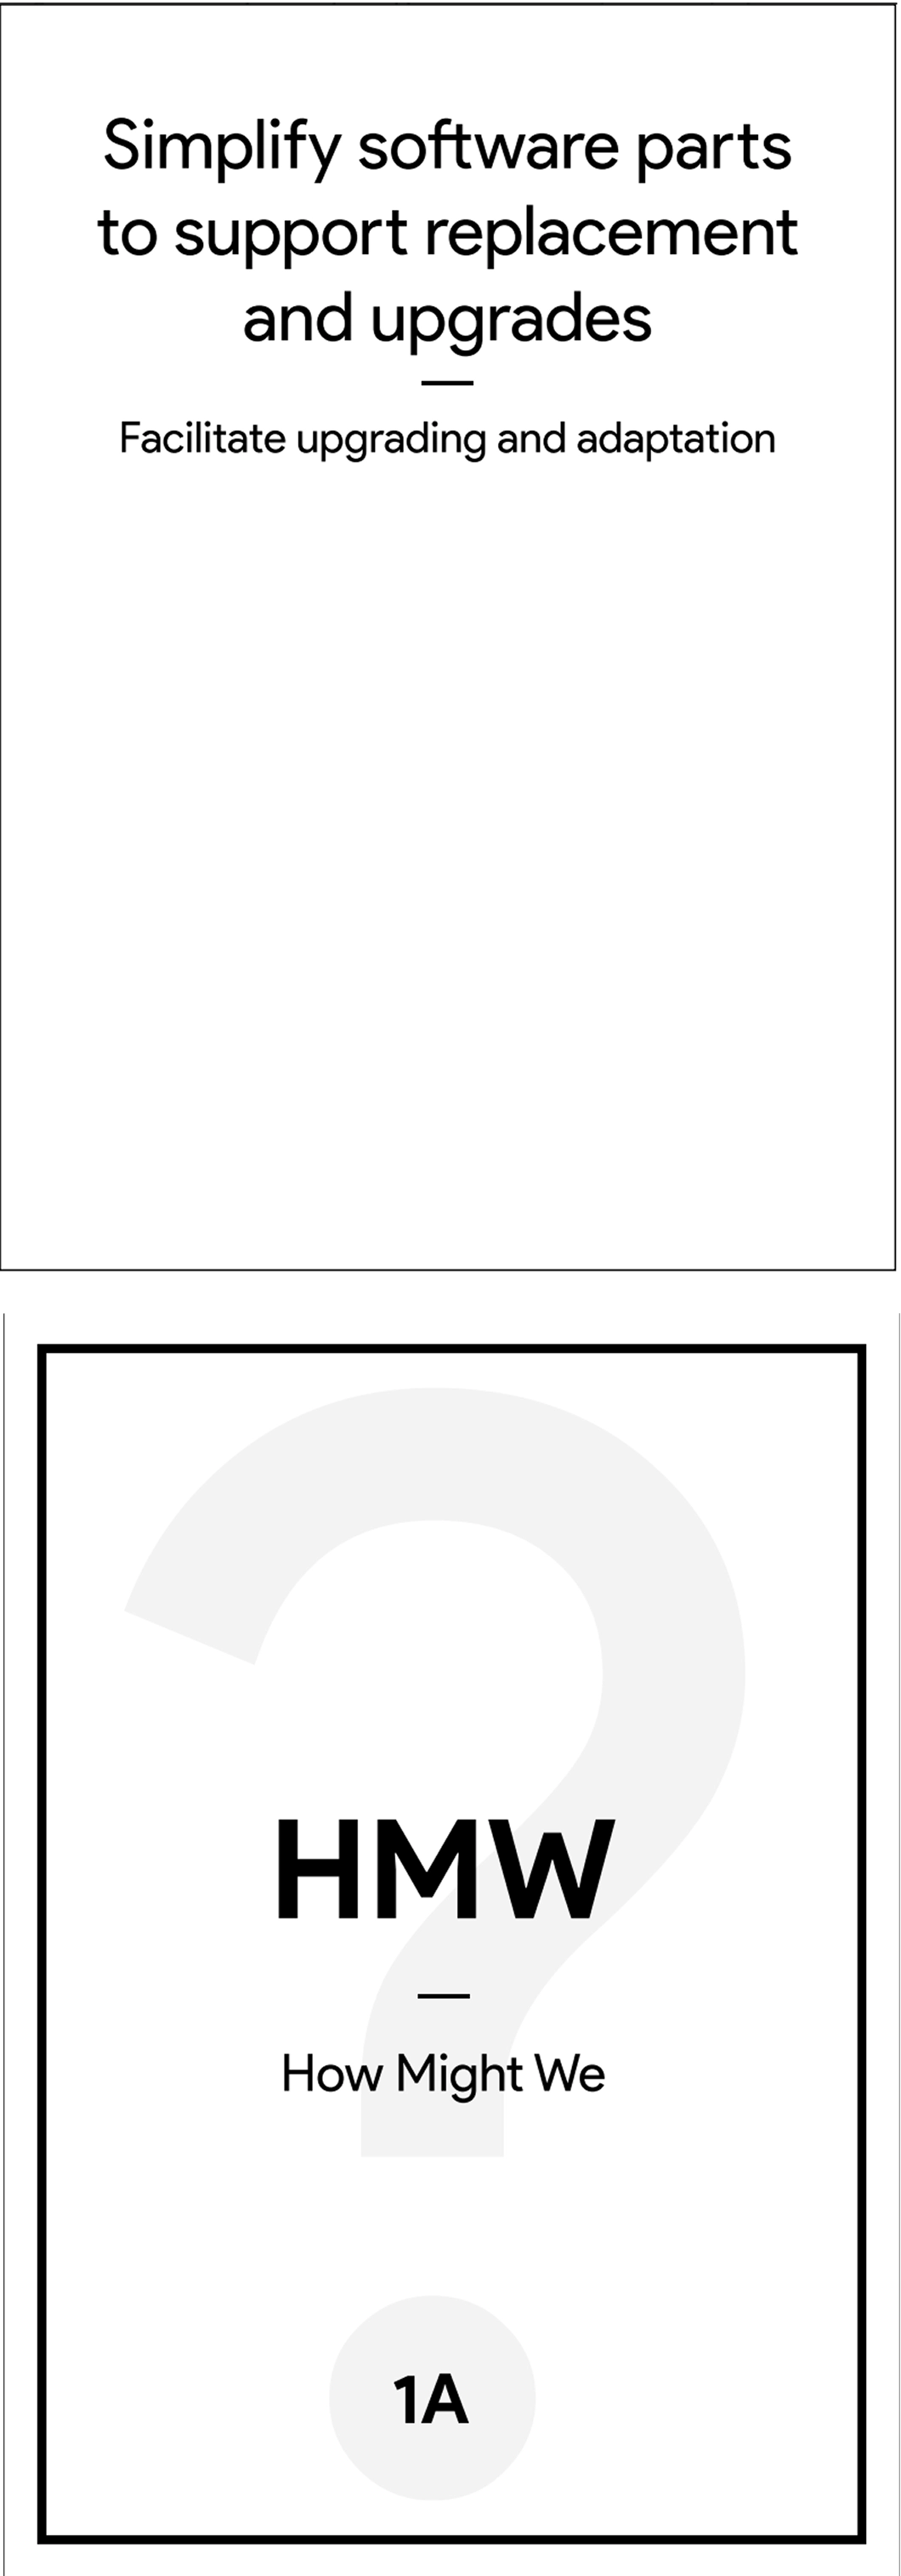
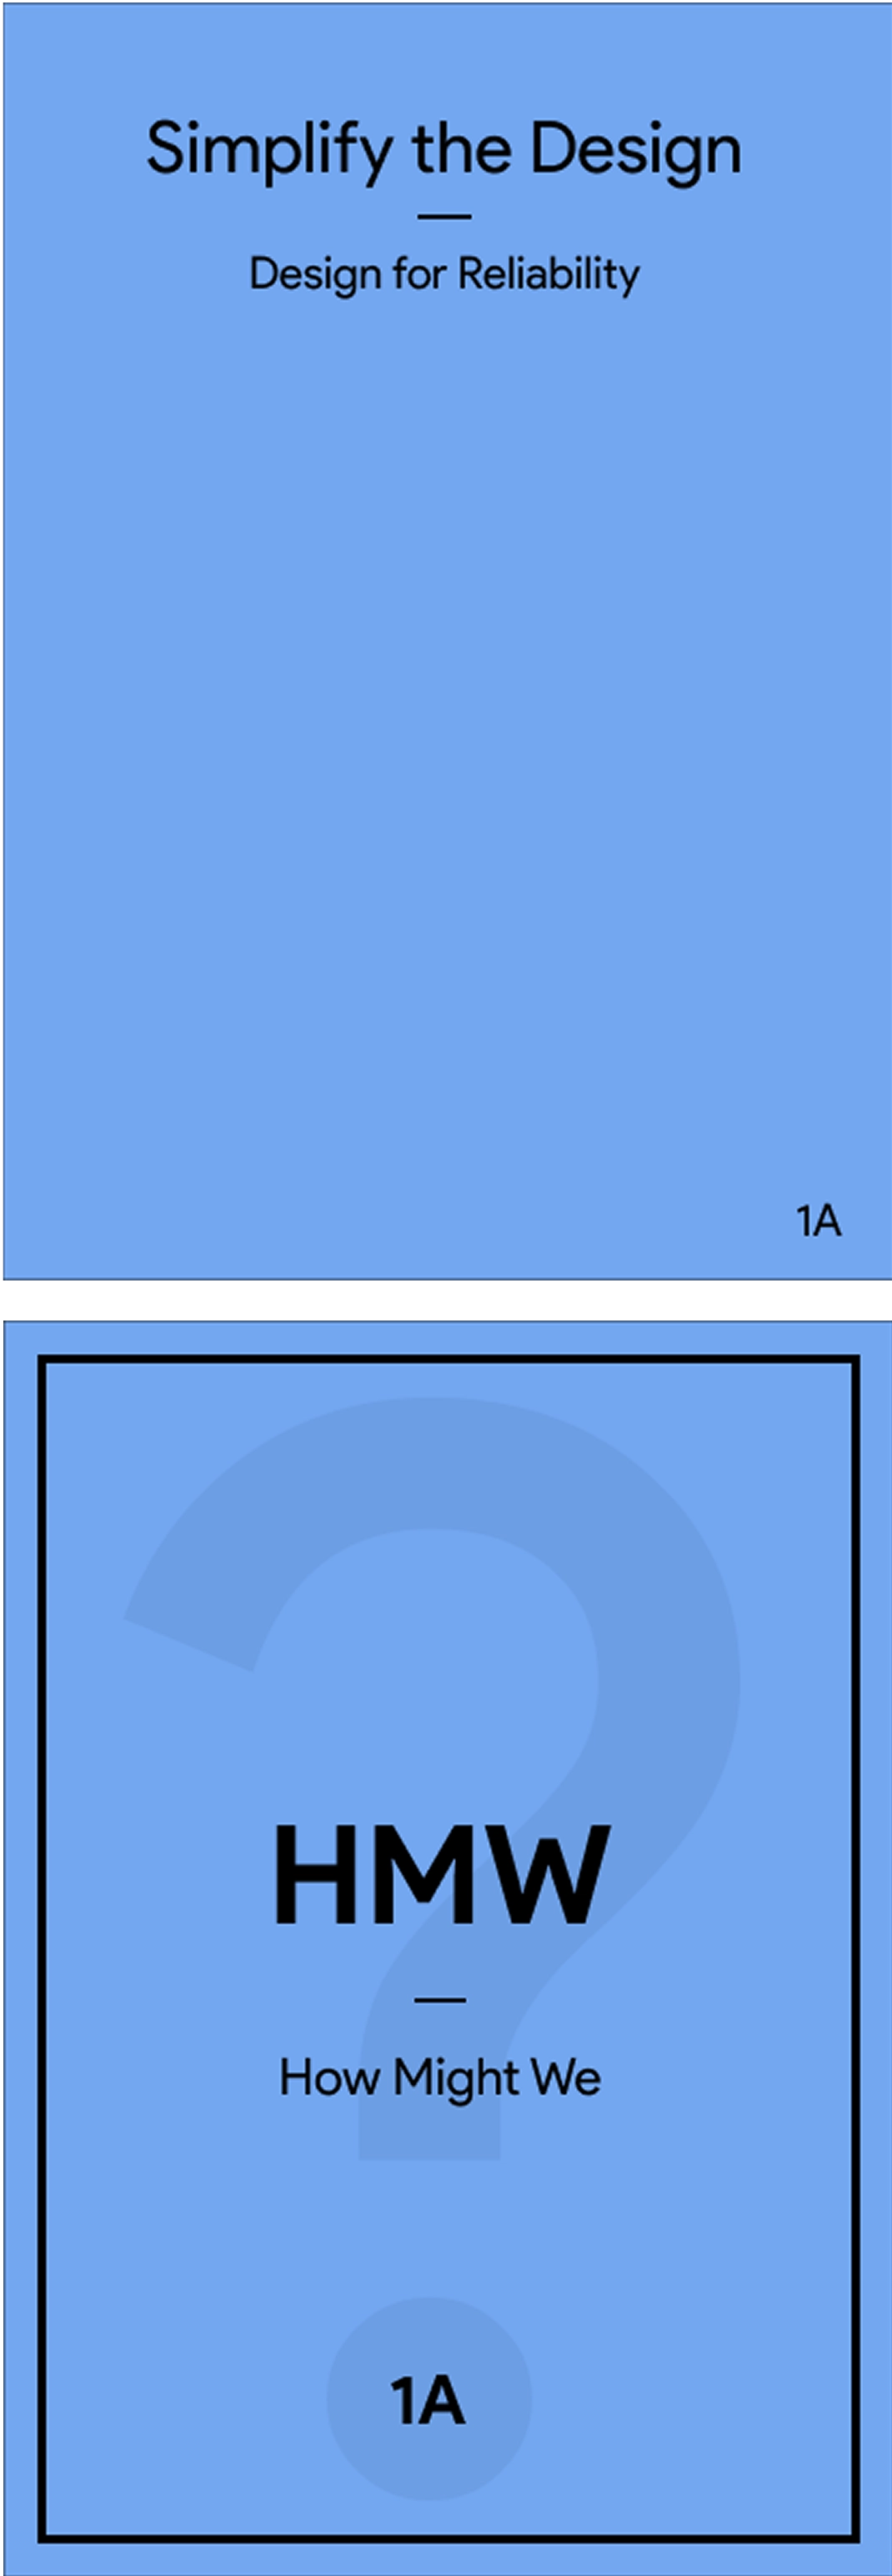
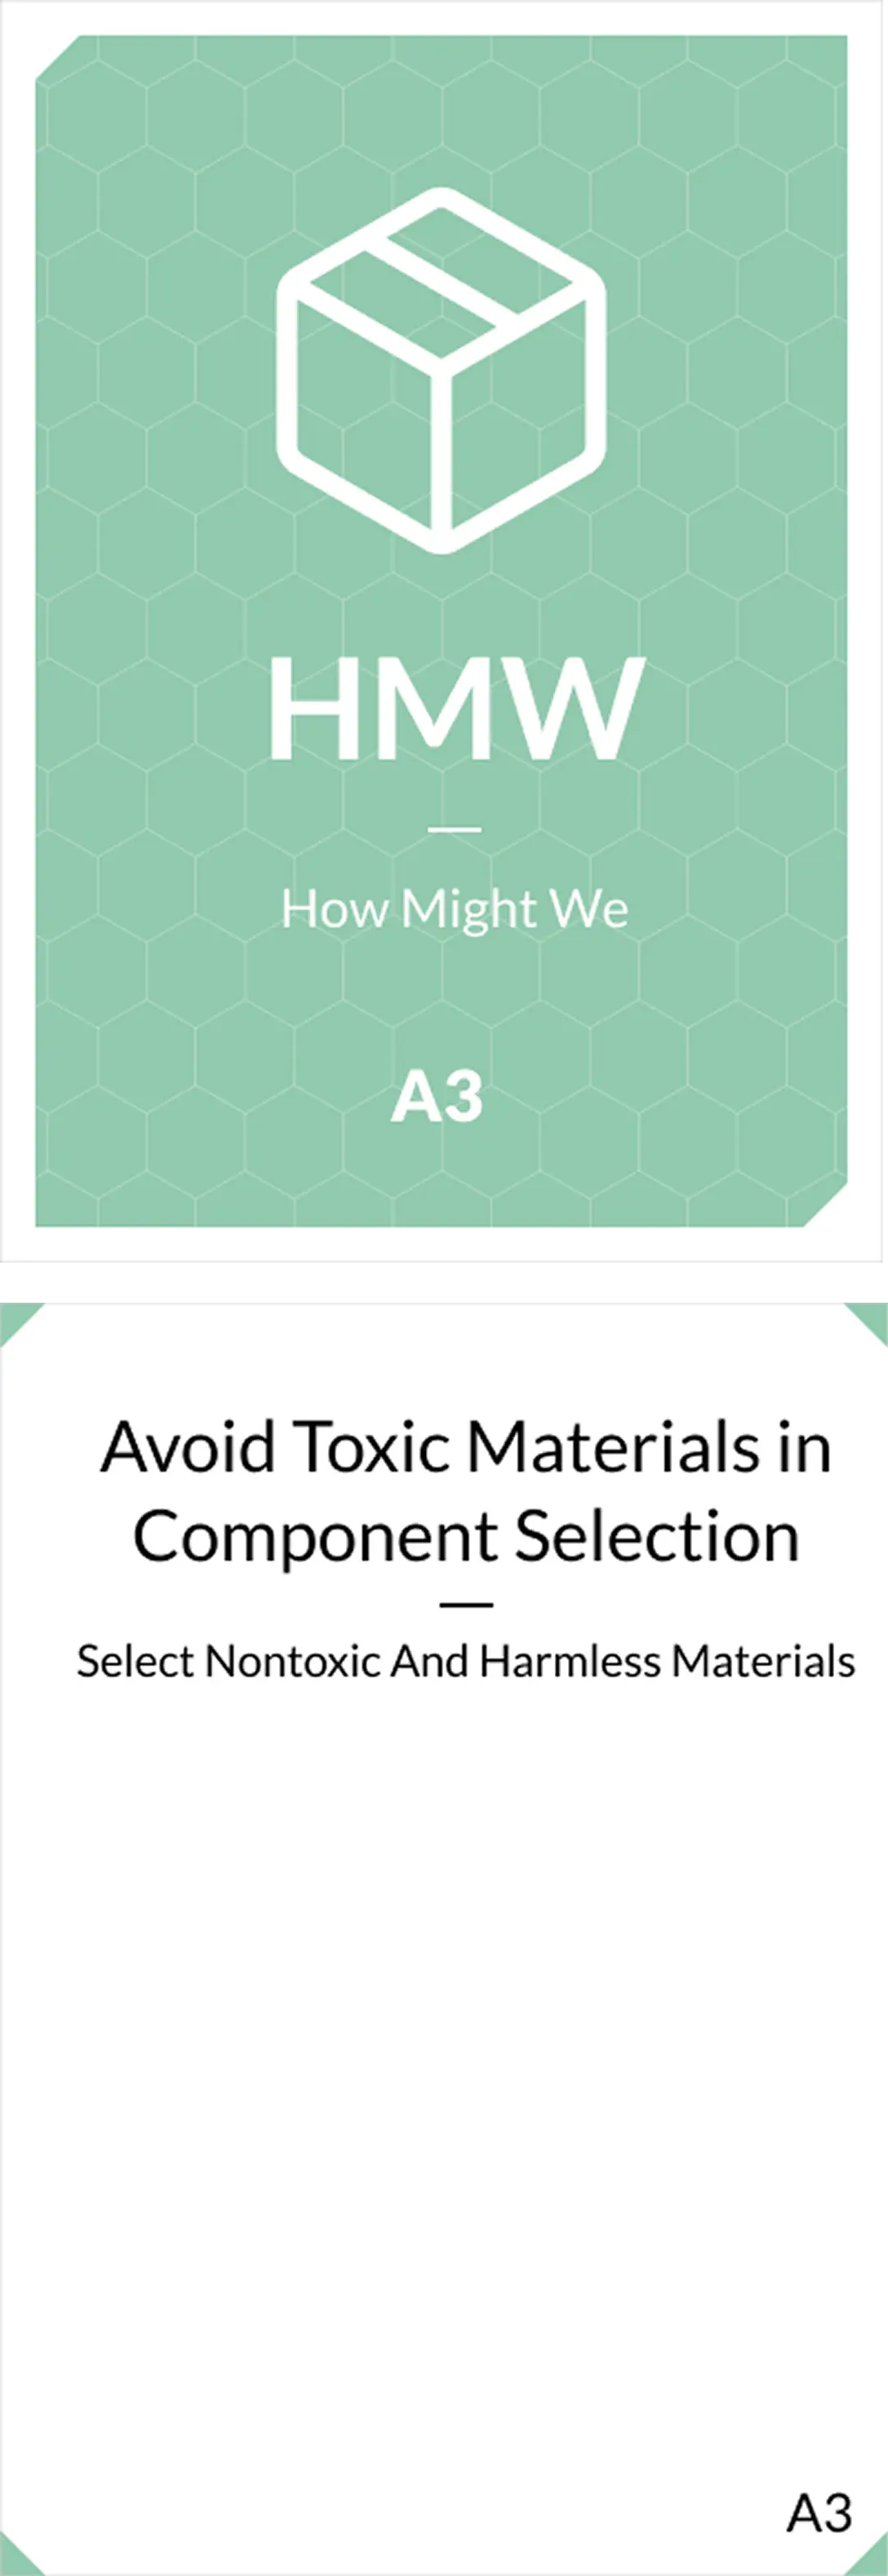
Externalizing the Excel based Ideation Cues
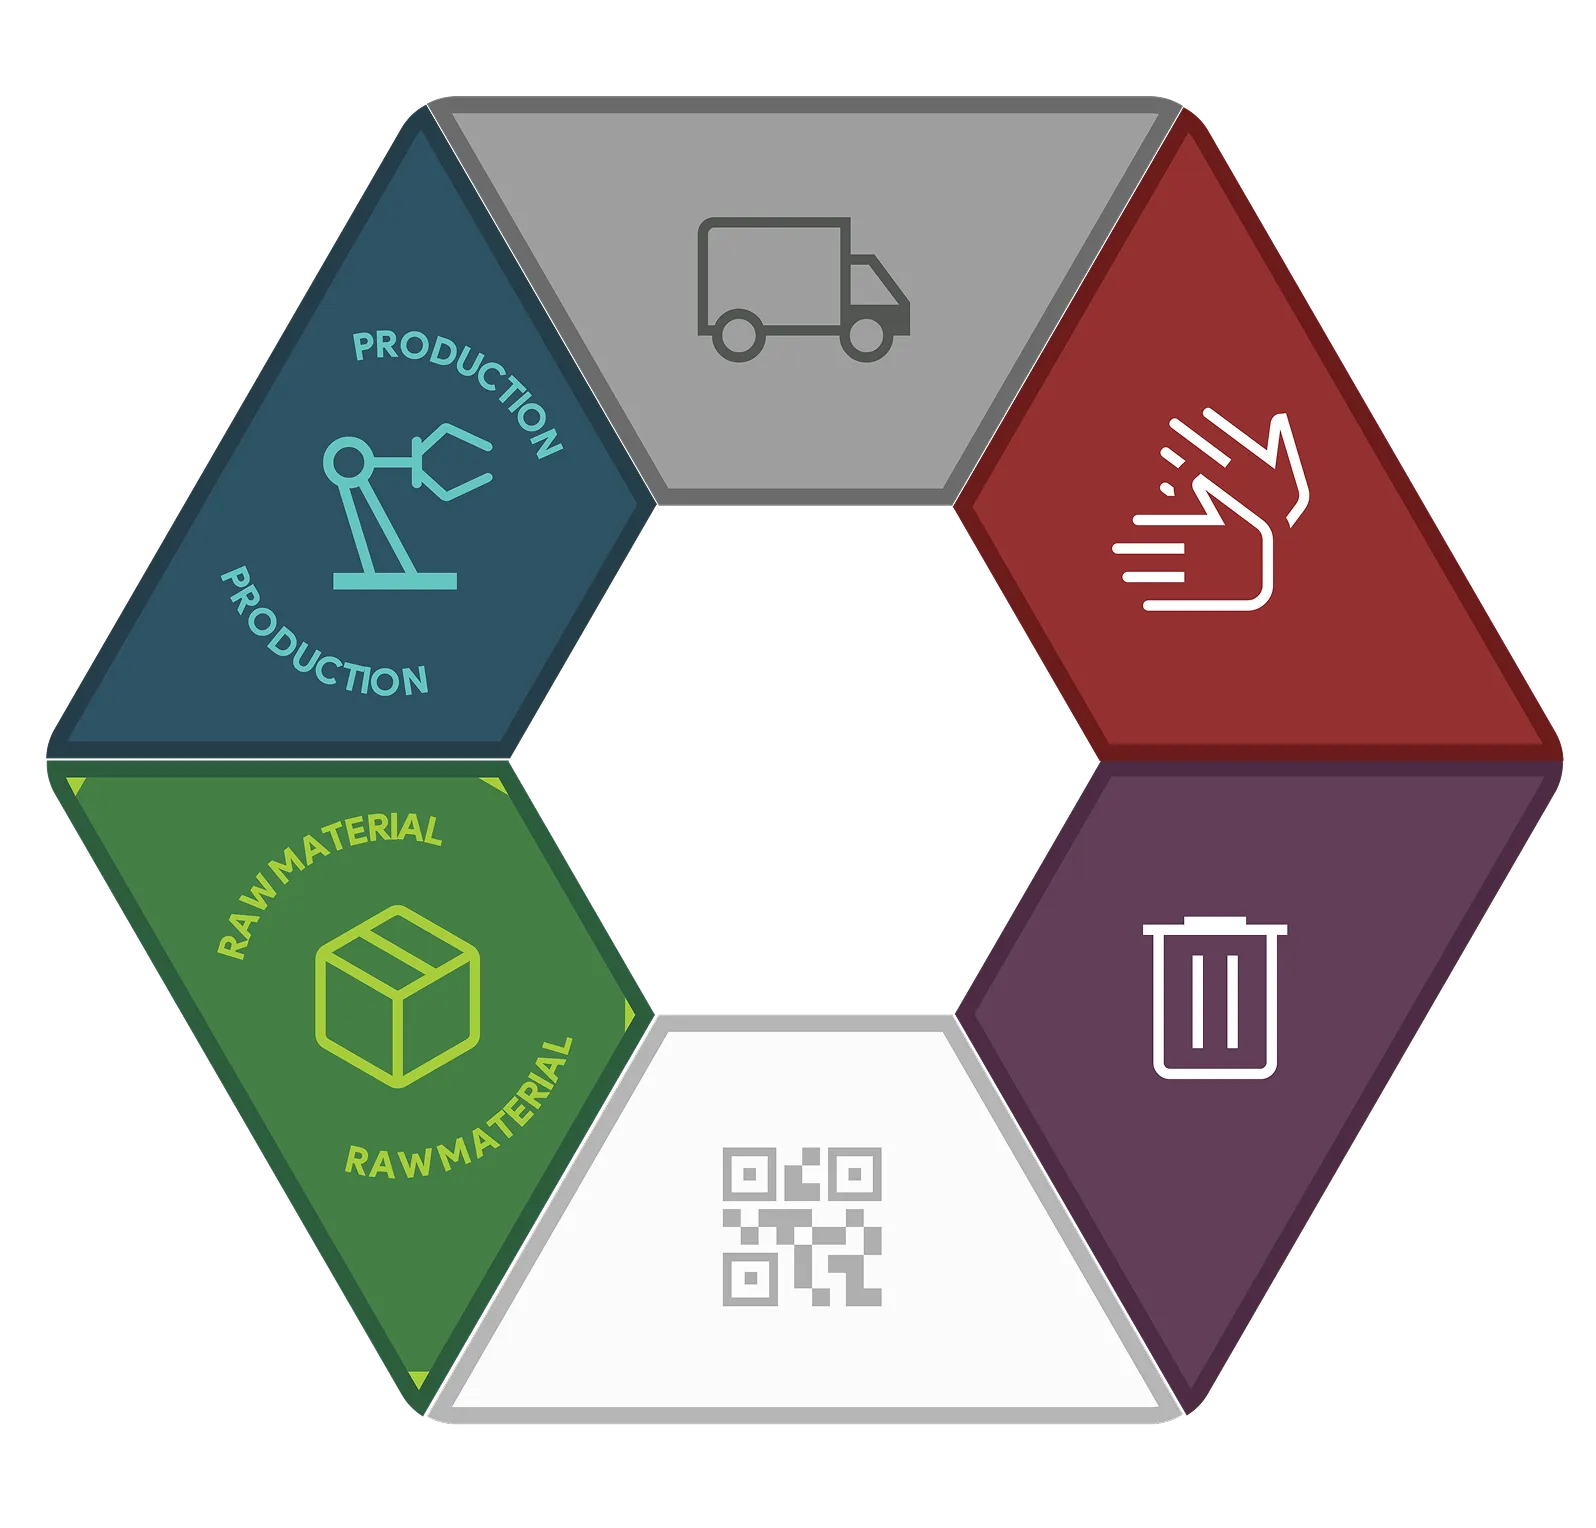
Ideation Cards
The first major step was to externalize ideation cues as physical, color-coded cards.
Each card represents a sustainability cue, grouped by product life cycle phase (Raw Material, Production, Transportation, Use, Disposal).
This made selection and collaboration tangible and intuitive.
Iterative prototyping and user testing ensured the cards were easy to use and understand.
The ICS toolkits Sub-strategies and the Ideation cues under each of them were externalised to support:
Collaborative ideation
Externalisation of insight to facilitate dialogue
As there were multiple Sub-strategies and the Ideation cues, now identifying a helping in selection was the need observed.
To further ease selections by segratating cards with respect to color coding on basis of sub-satrategeis
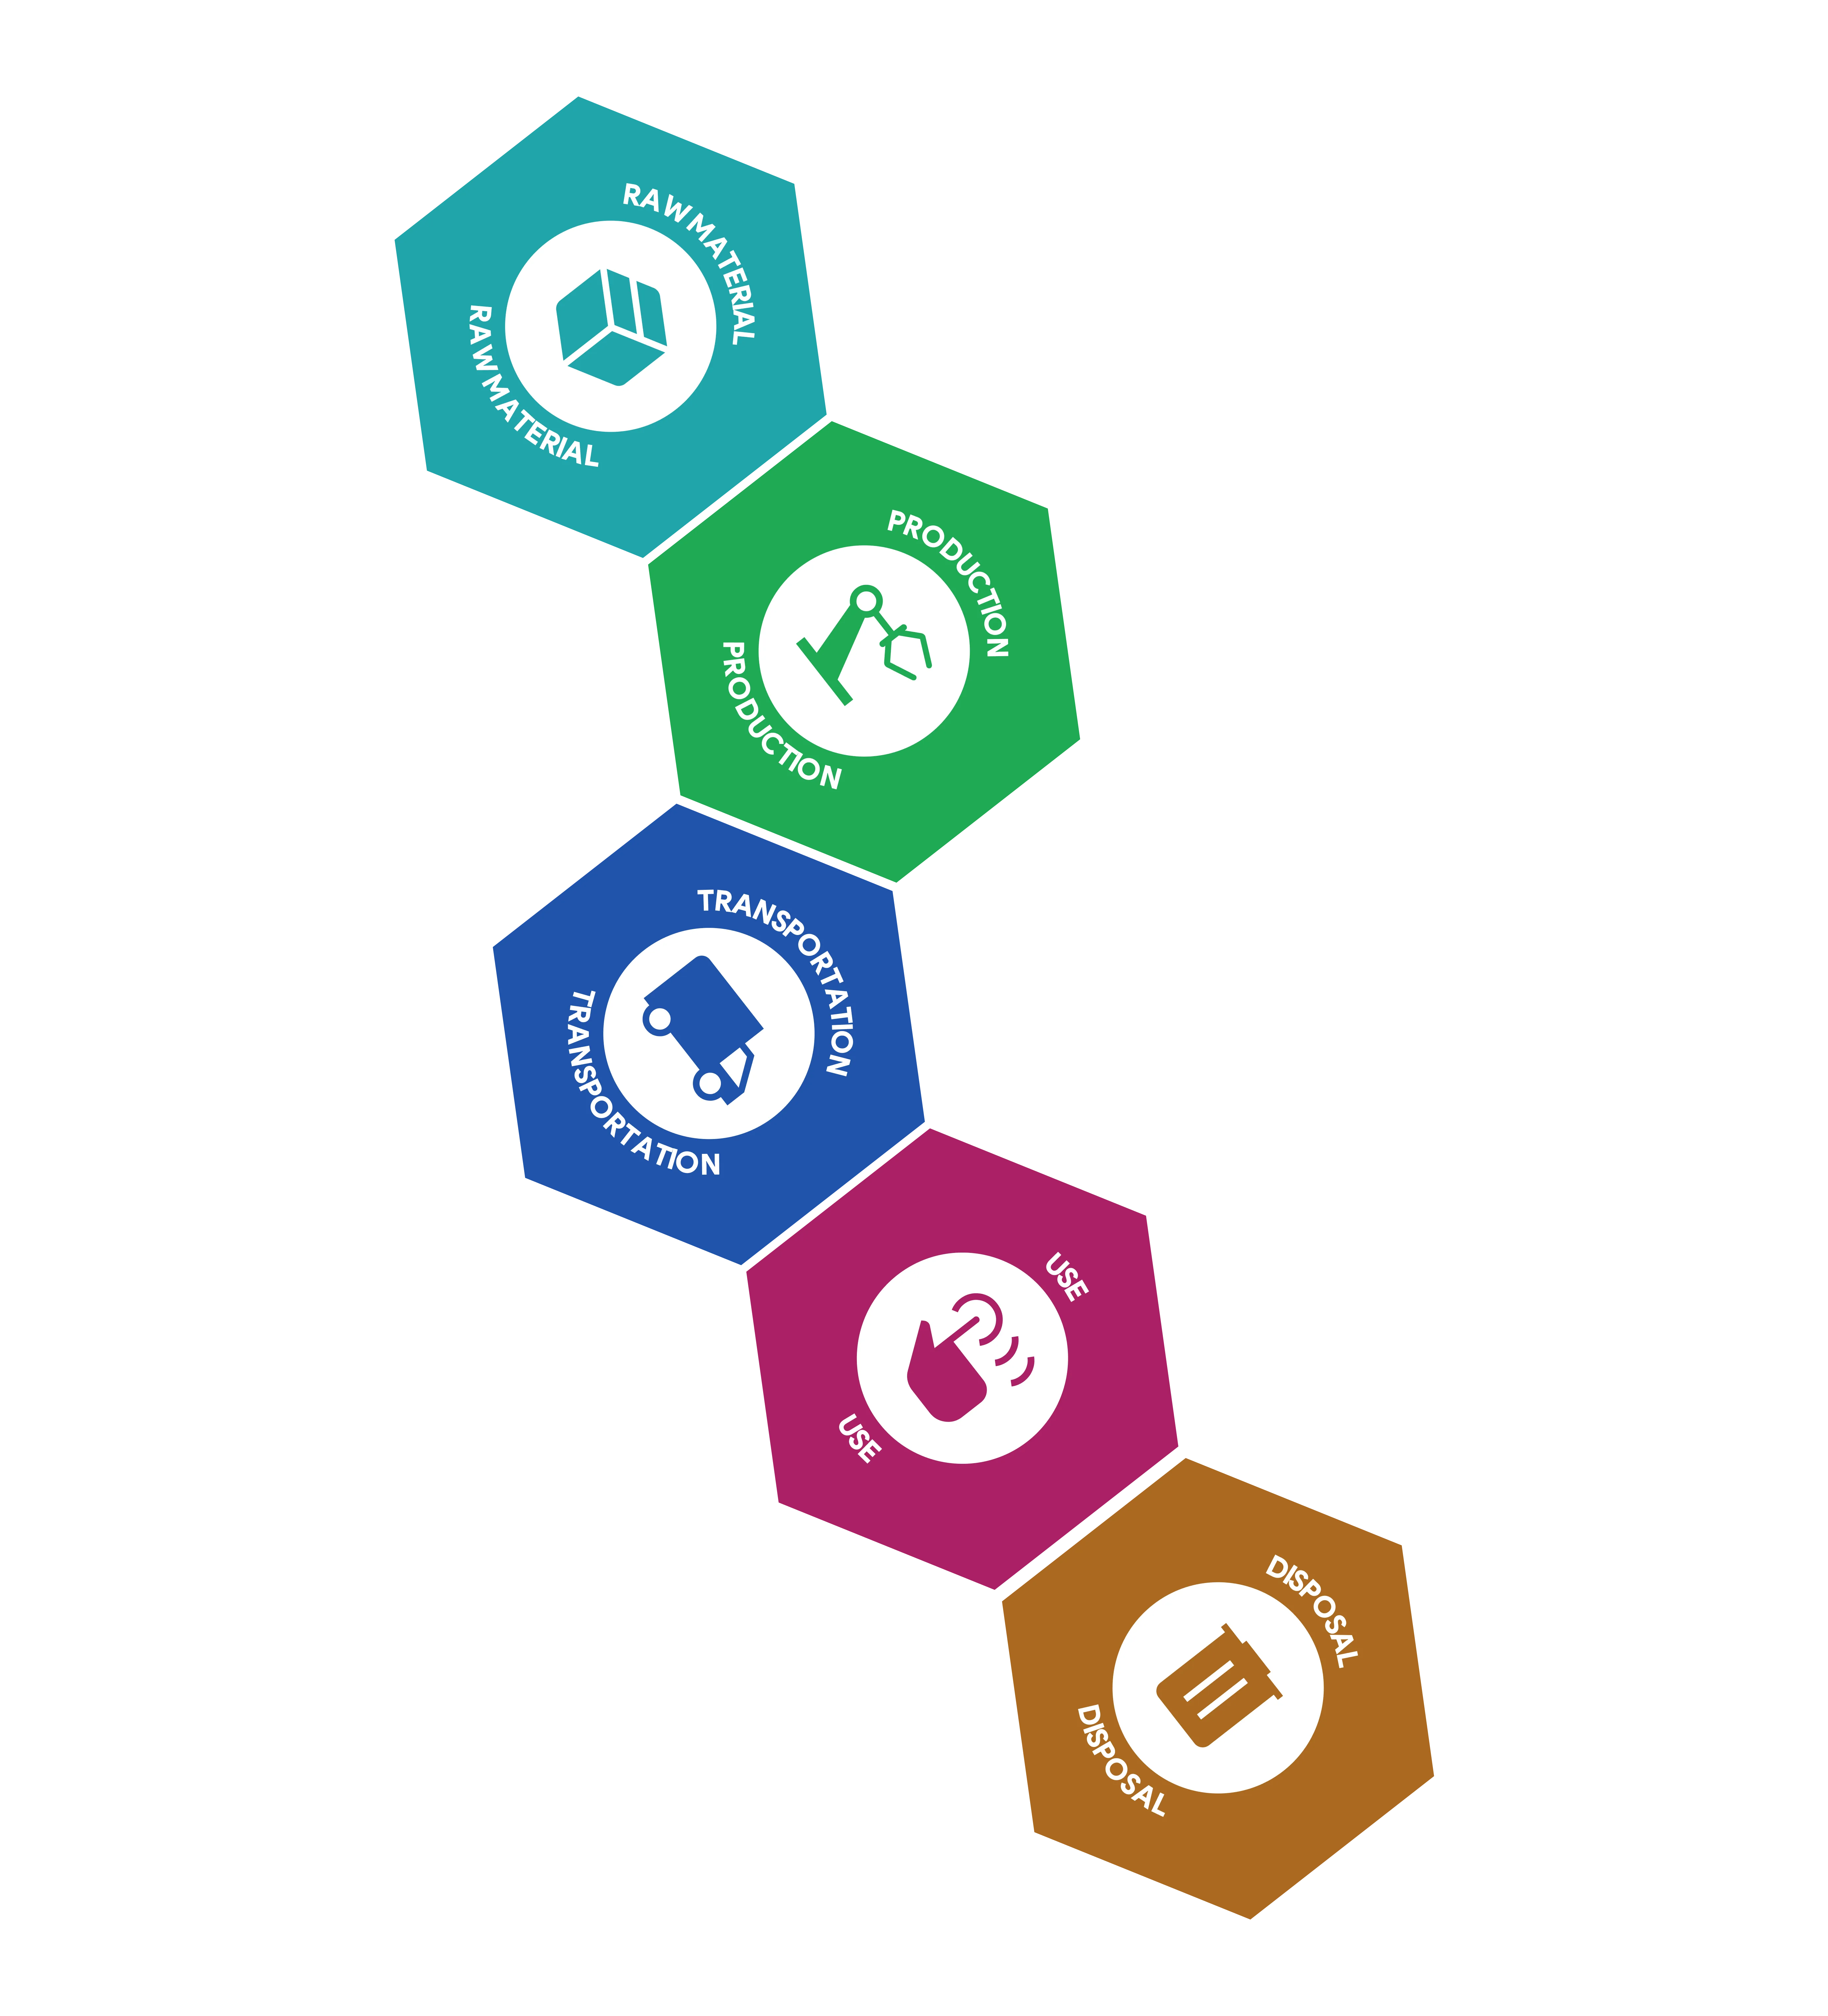
Grouping the Ideation cards into product life cycle phases(instead of previous Sub-strategies) with motifs and colors:
Raw material
Production
Transportation
Use
Disposal
Guiding users to proceed with ideation
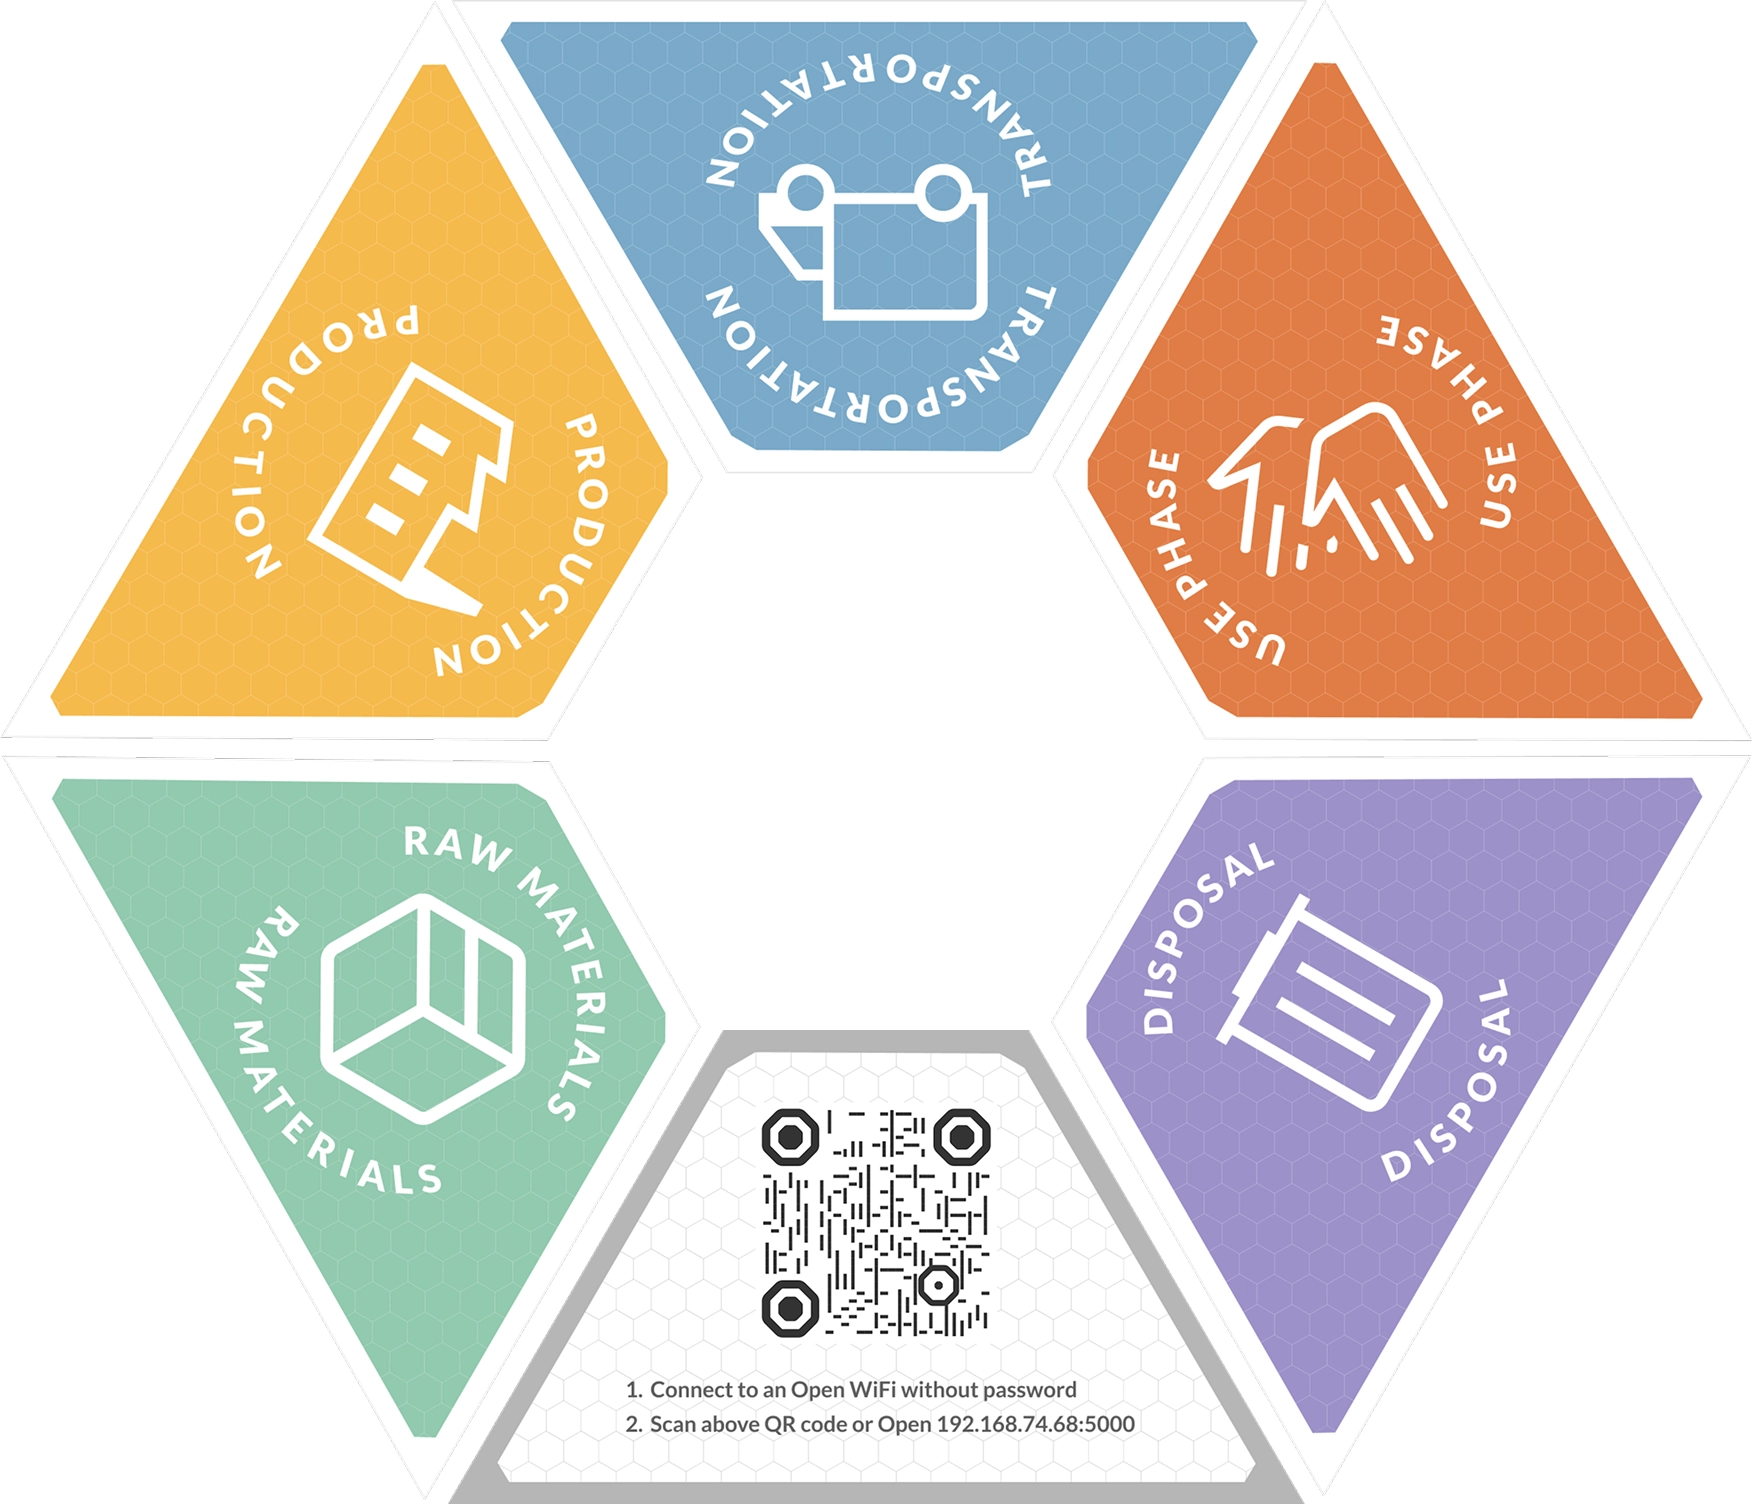
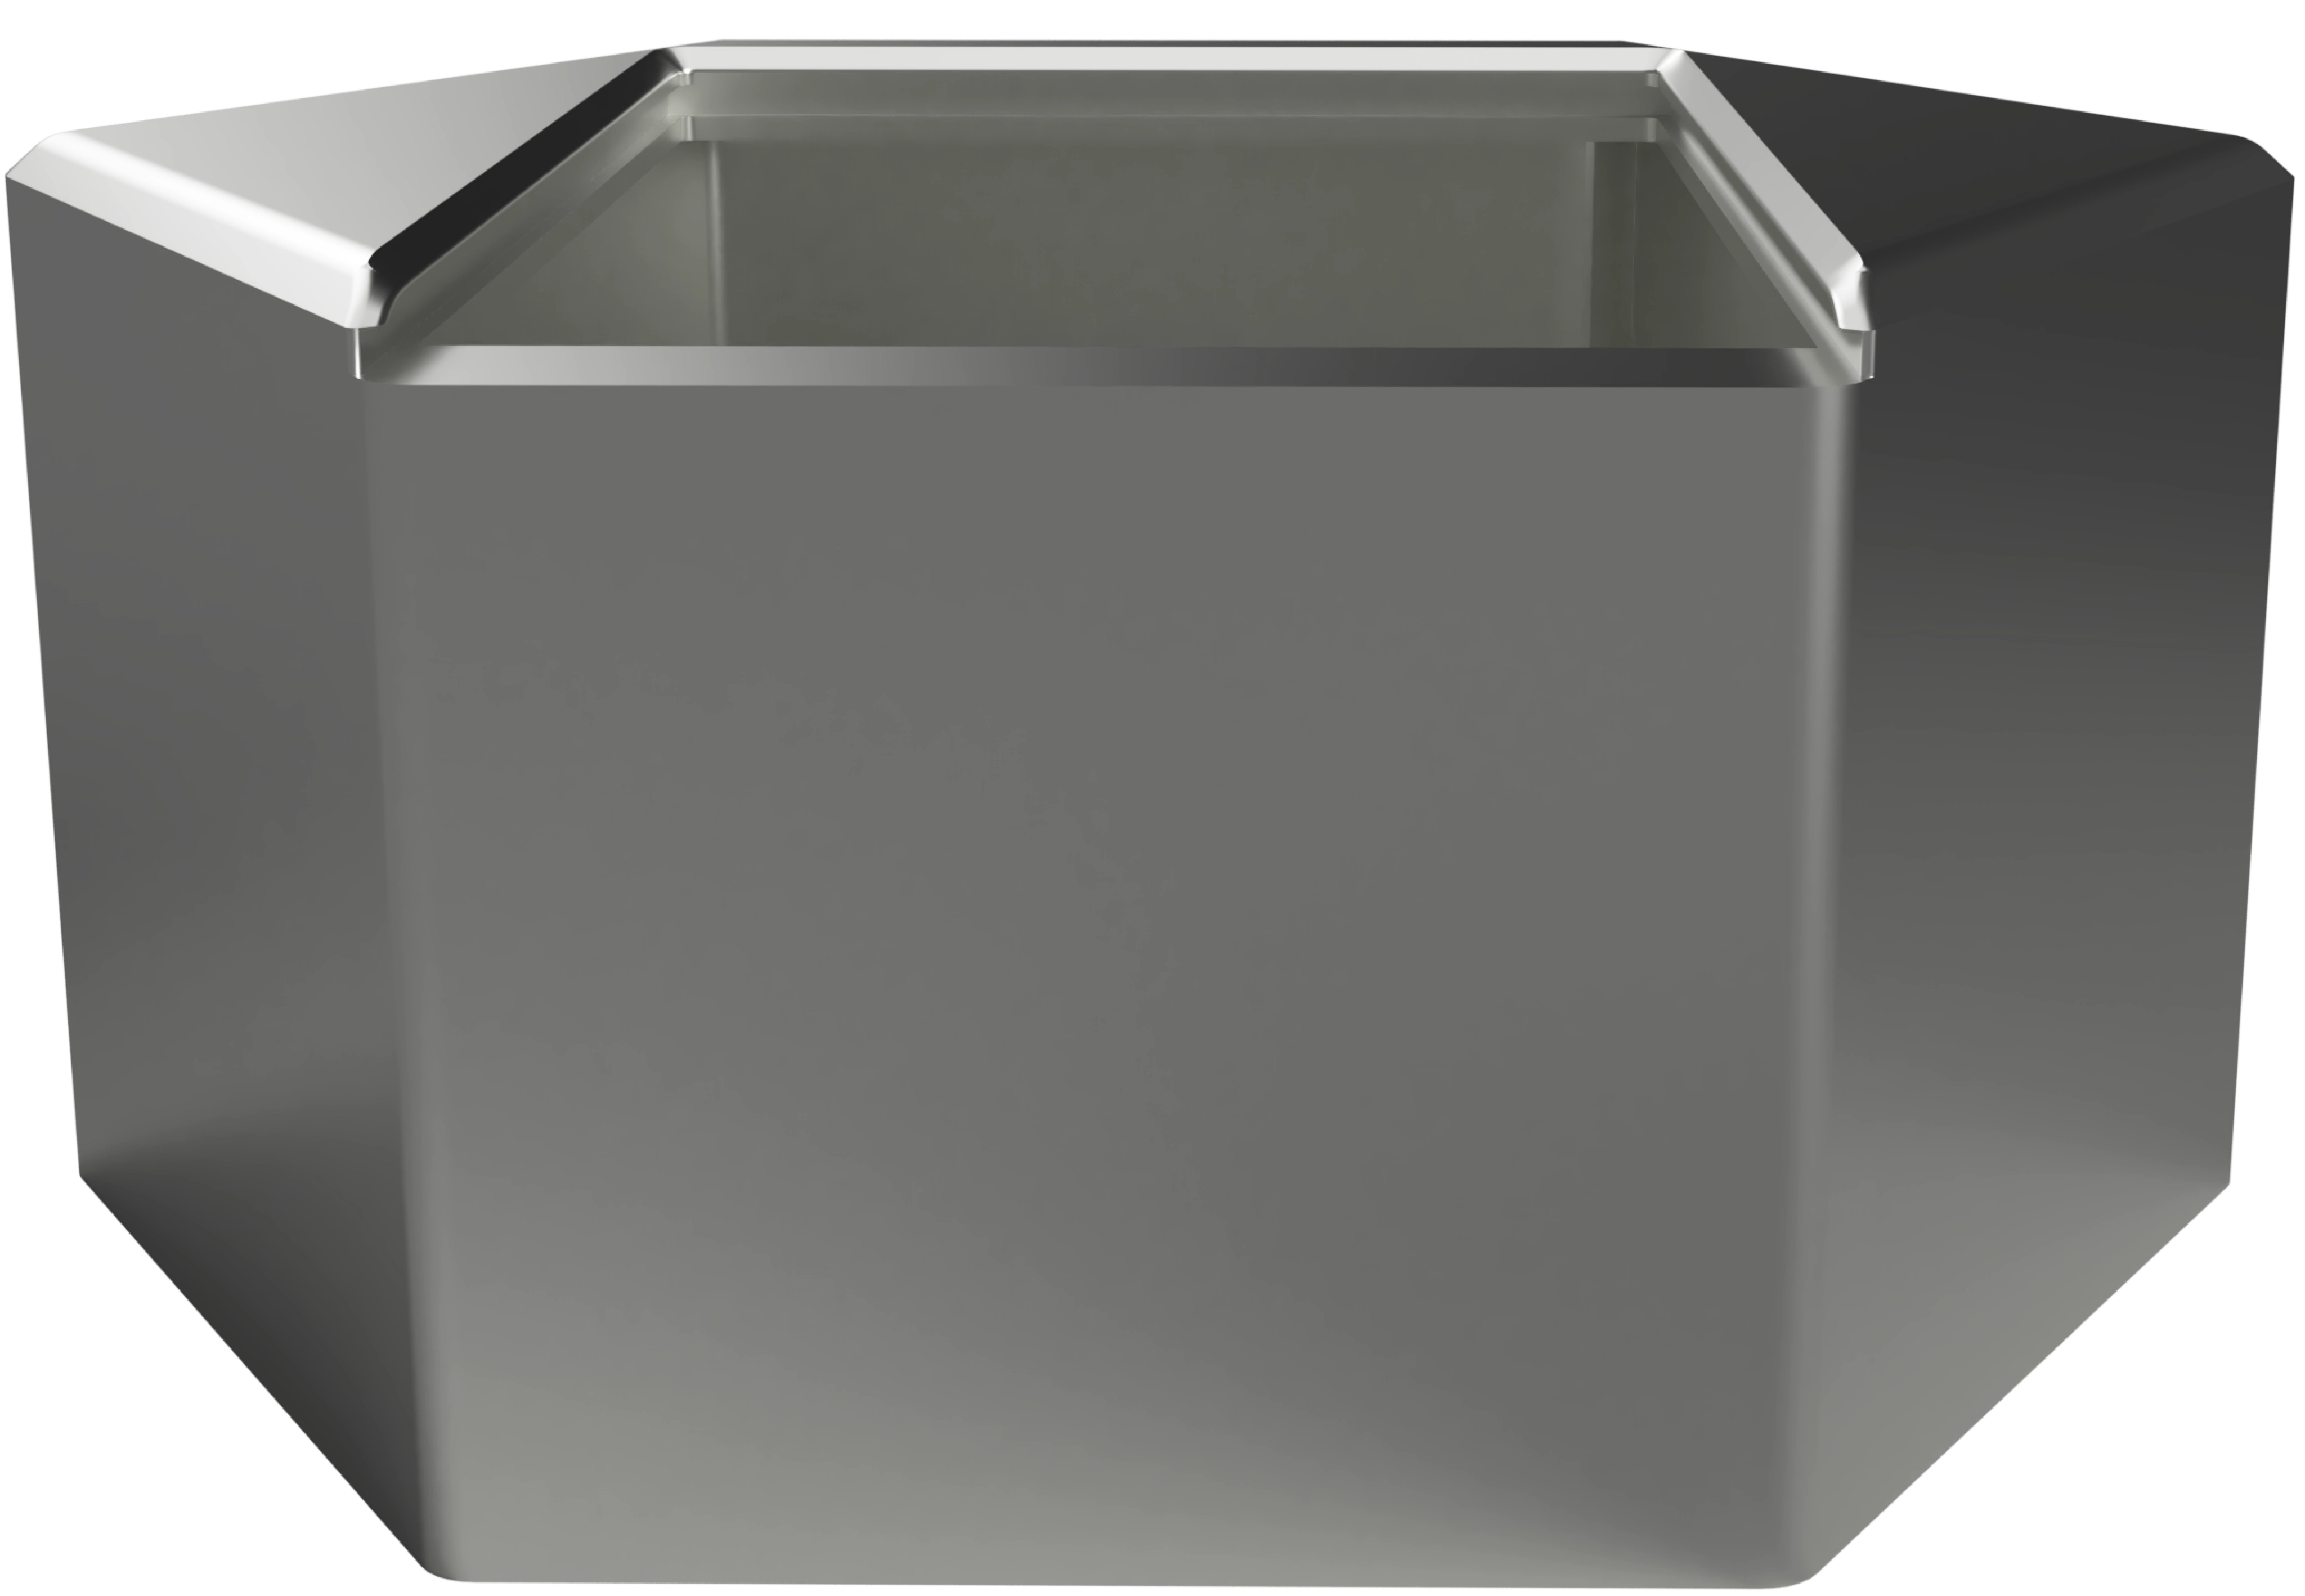
Idea board
The ideation cards alone weren’t enough; users needed structure.
I designed a modular, hexagonal idea board to help teams distribute and arrange cards by life cycle phase.
The board reduced cognitive load and made the process feel more like a collaborative game.
The central scanner and circular arrangement reinforced the product’s life cycle concept.
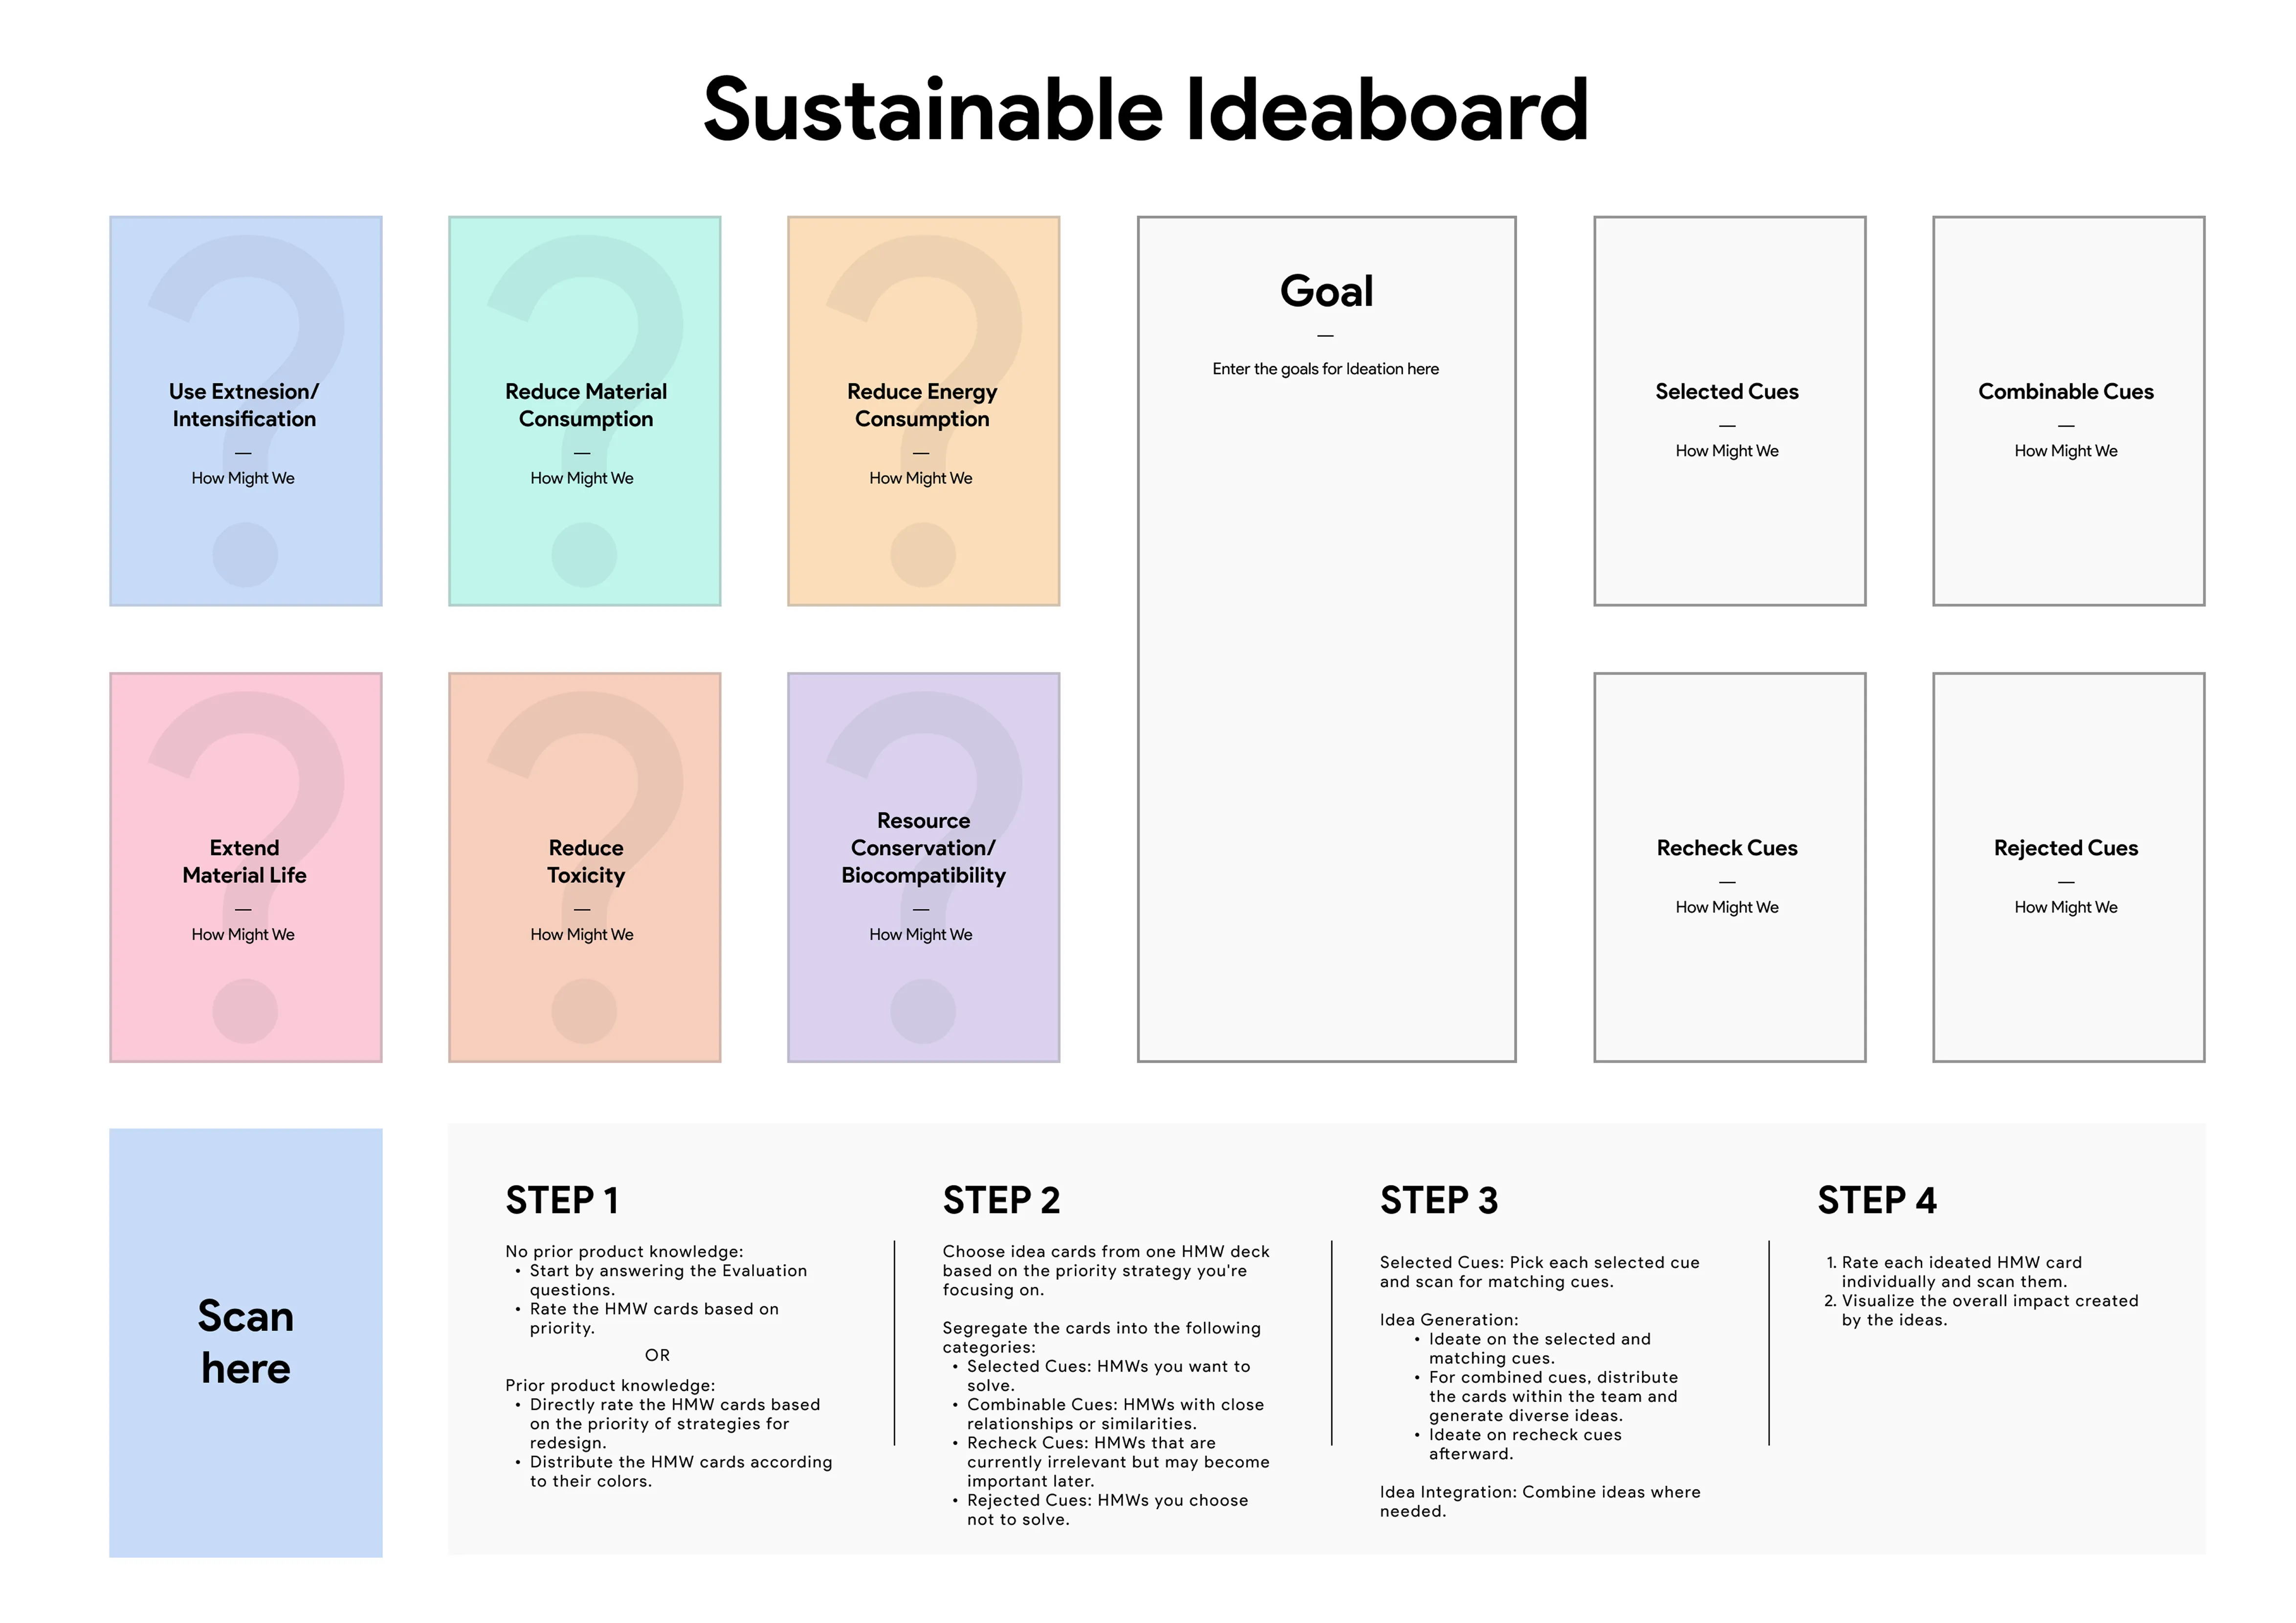
The board helps:
Structure the ideation process
Helps in reducing the deck size by eliminating cards
Motifs were now grouped as life cycle phases as inspired by final designs of ideation cards and hexagonal tiles for close packing and to allow for placment of hexagoalnal Scanner.
The hexagonal can now be placed in between the trapezoid tiles which encircle the Scanner to indicate circular nature of product life cycle phases.
Grouping the Ideation cues into product life cycle phases:
Raw material
Production
Transportation
Use
Disposal
Visualizing the UI
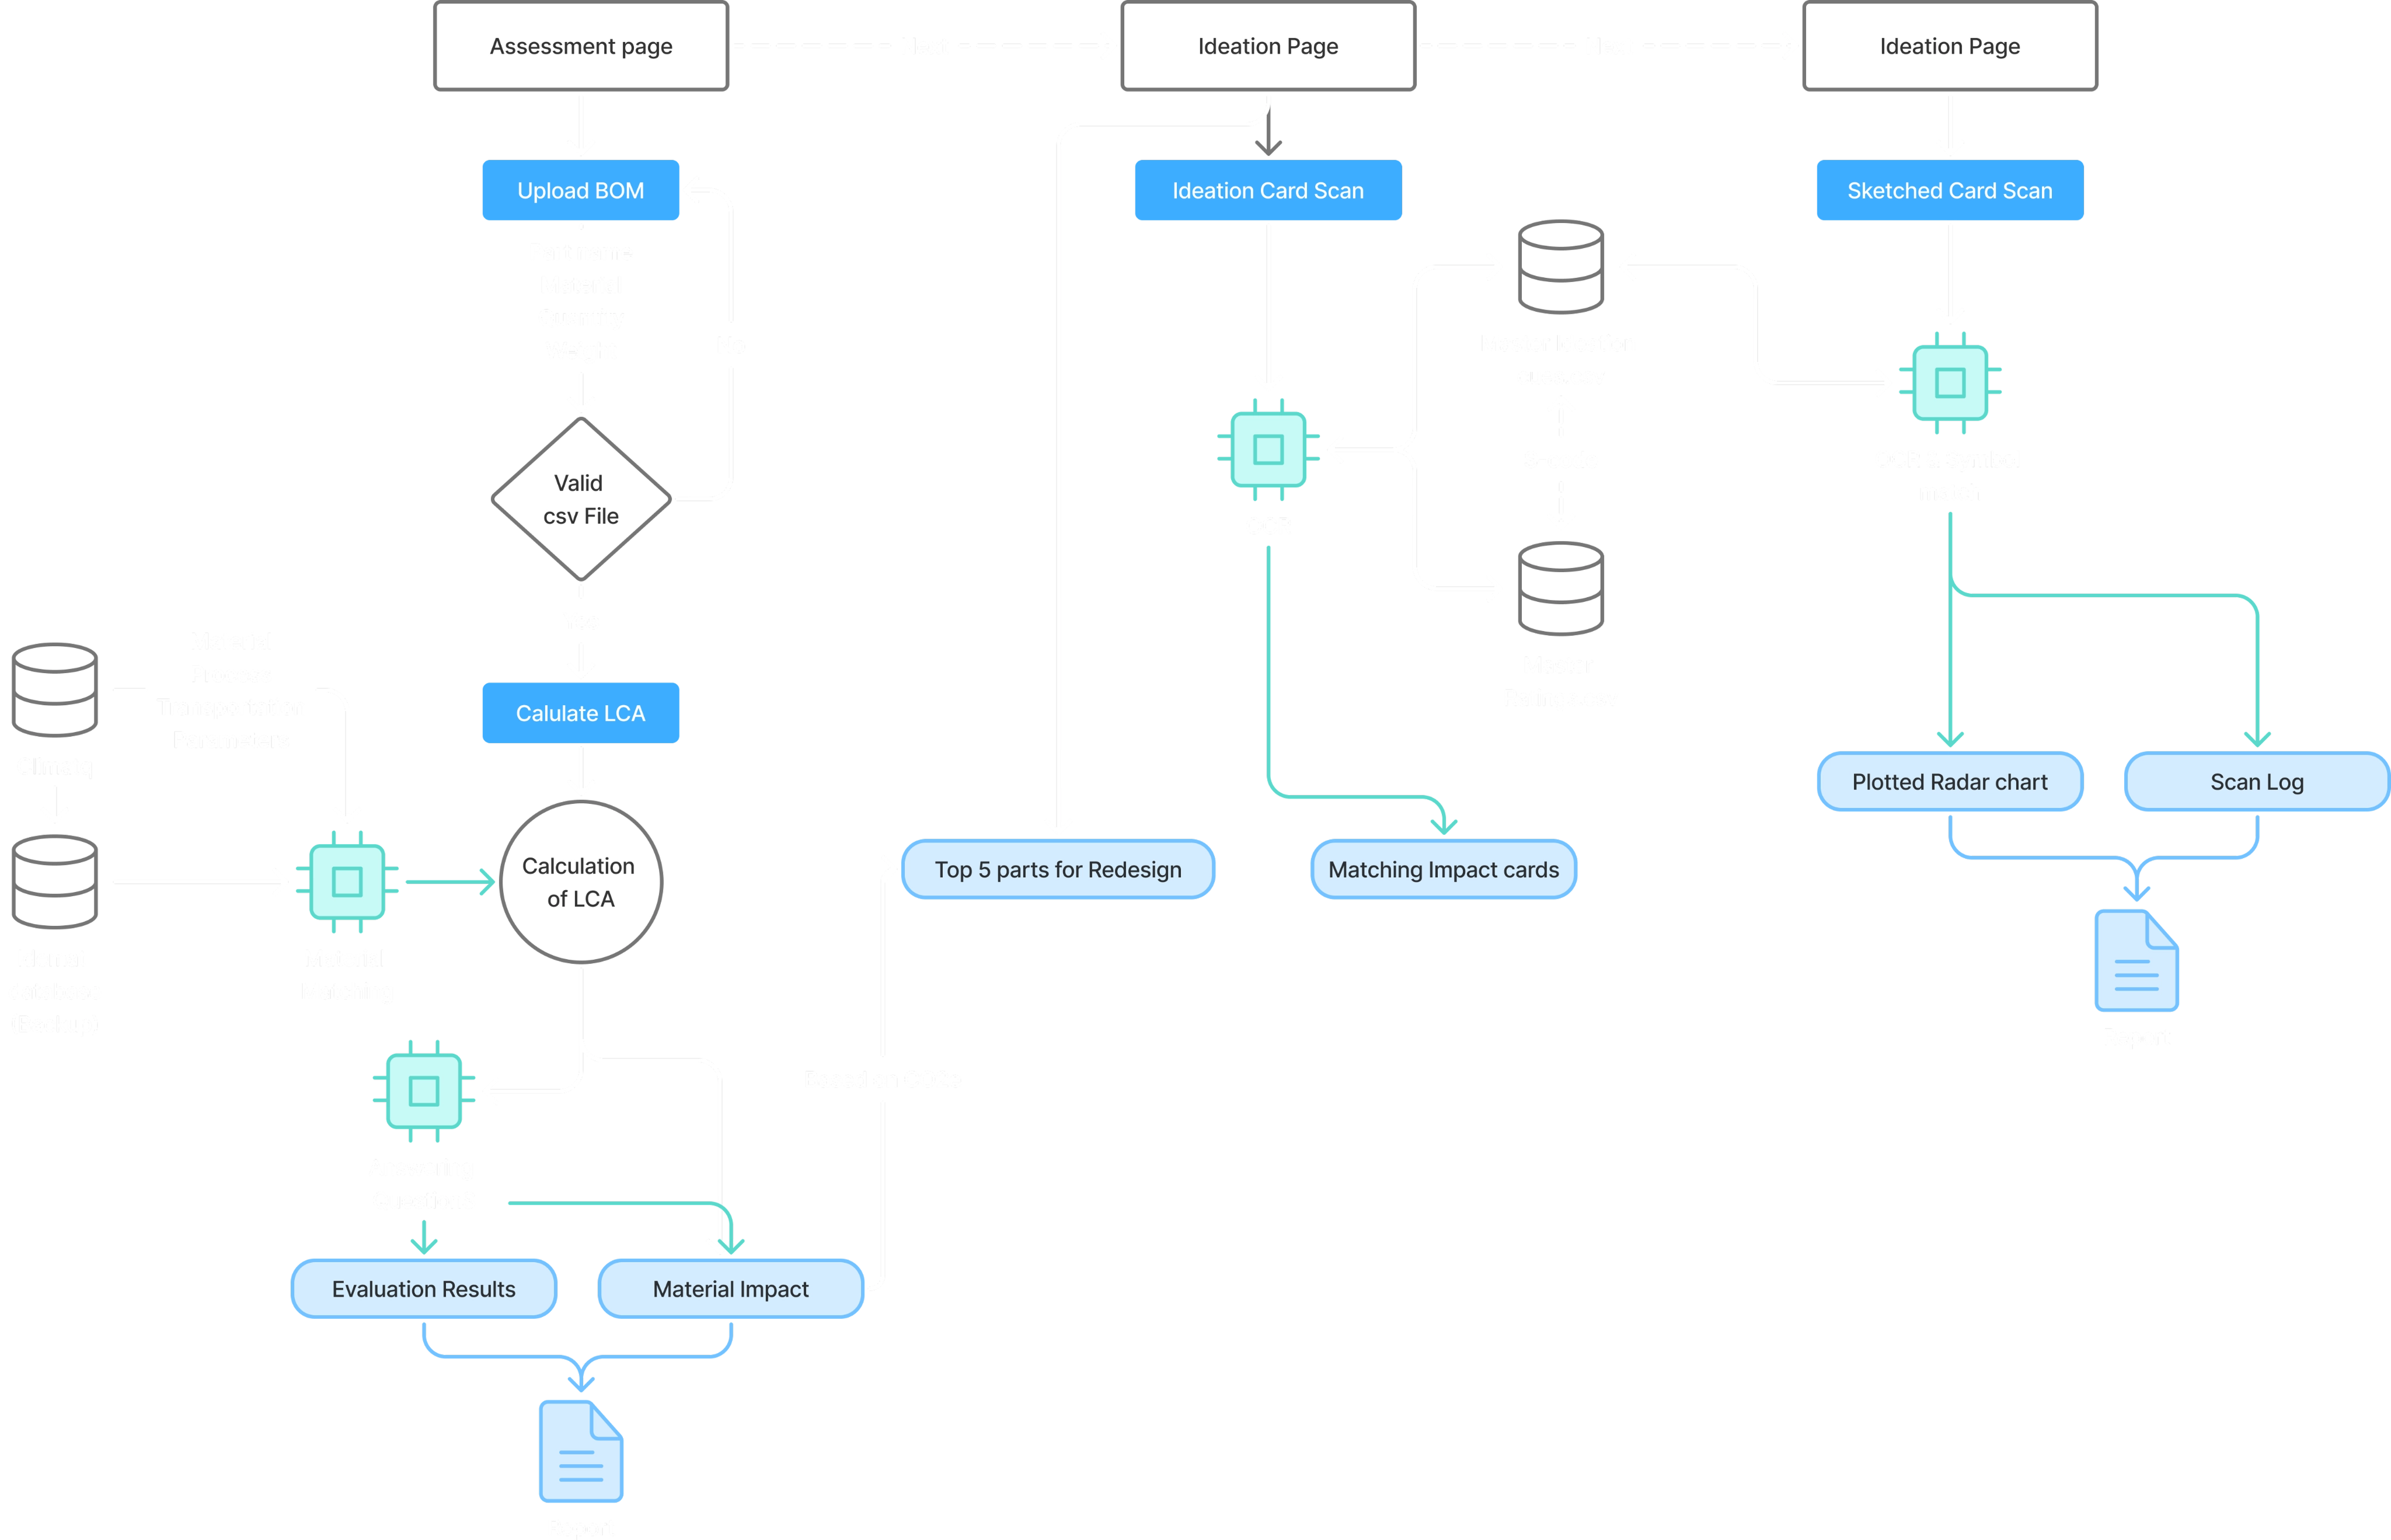
Data Flow Diagram
AI powered features
- Material Mathcing: The materials in the Bill of Materials (CSV) is mathced with the Climatiq or the local Idemat database.
- Answering Questions: Gemini NLP api is used to answet evalaution question on the basis of most impacting materials
- OCR: Deduce the card scanned based on the code on the cards
- OCR & Symbol match: Match the improvment level with respect to Ideated sketches
Seamless Ideation : From Ideas to Sketches and then to more Sustainable Products
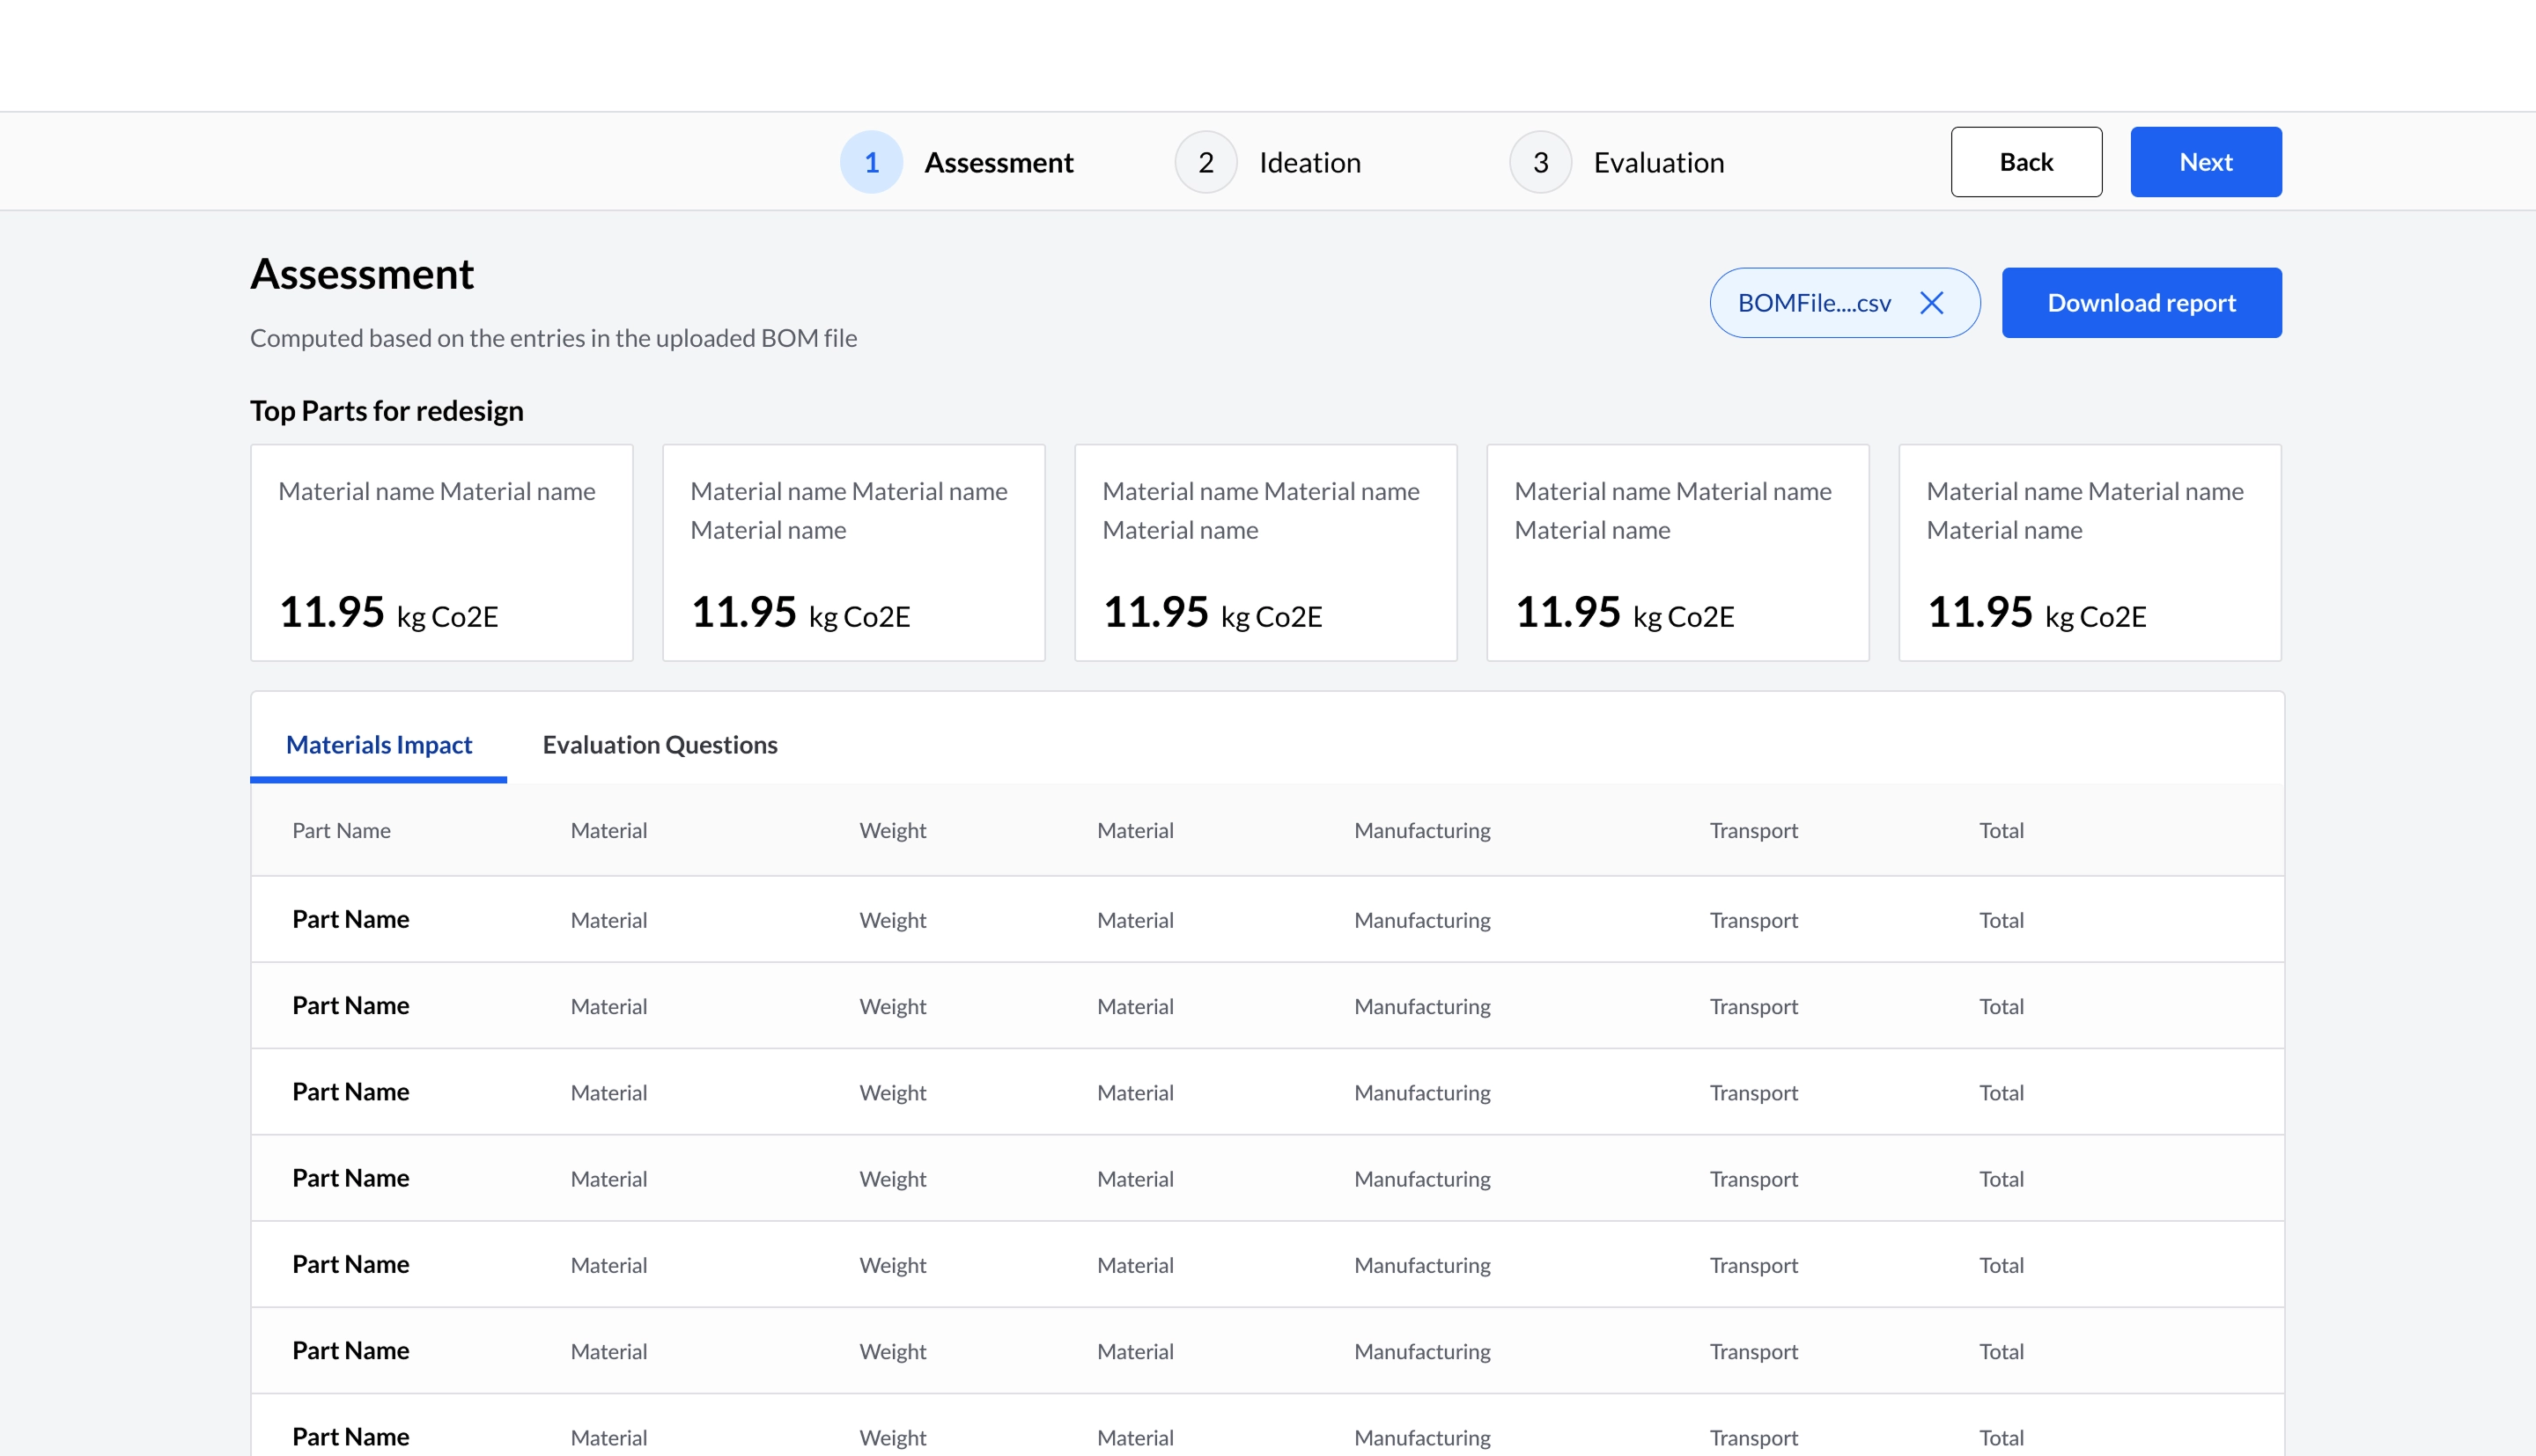
Assessment
AI powered features
- Upload BOM: Teams upload their product’s Bill of Materials (CSV).
- AI-Powered LCA: The system calculates carbon footprint and identifies top-impact parts.
- Actionable Insights: Recommendations are generated for redesign priorities.
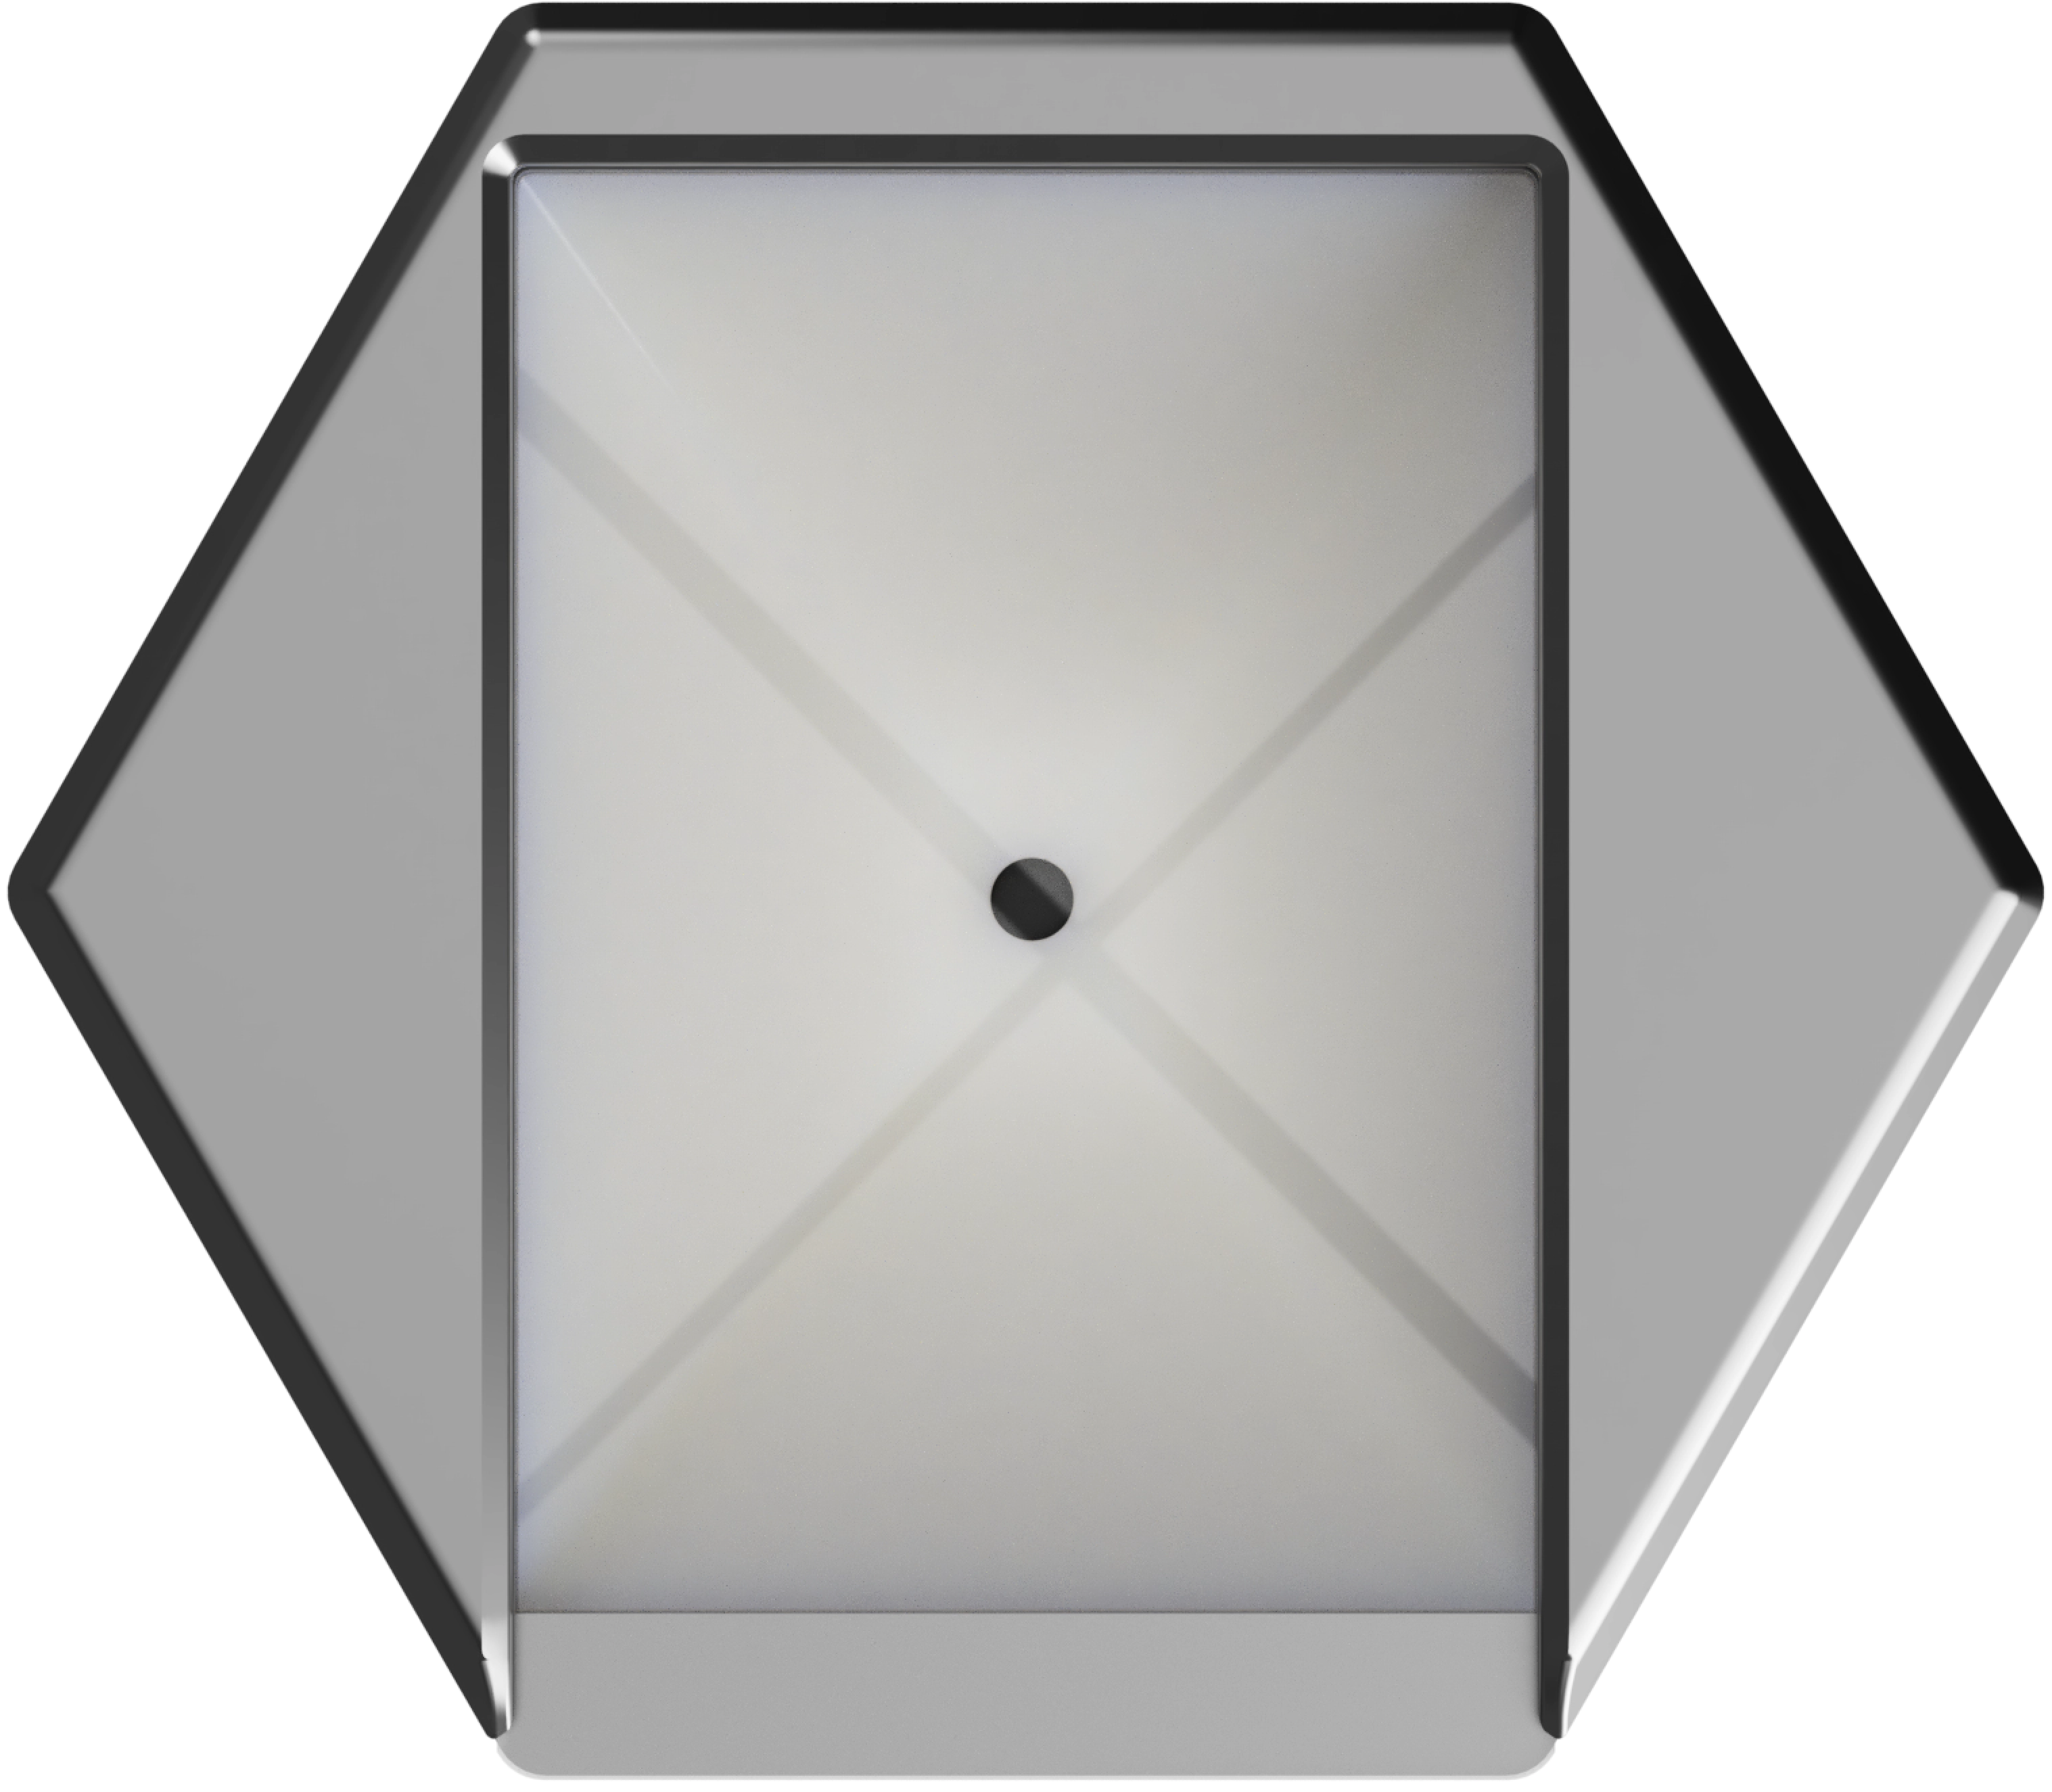
The Scanner has a Raspberry Pi 4 motherboard connected to a camer and 4 LEDs.
The motherboard has the code running in it to power the sustAInable dashbaord.
.webp)
Intranet Dashboard for collaborative sustainable product designs
Assessment
AI powered features
- Upload BOM: Teams upload their product’s Bill of Materials (CSV).
- AI-Powered LCA: The system calculates carbon footprint and identifies top-impact parts.
- Actionable Insights: Recommendations are generated for redesign priorities.

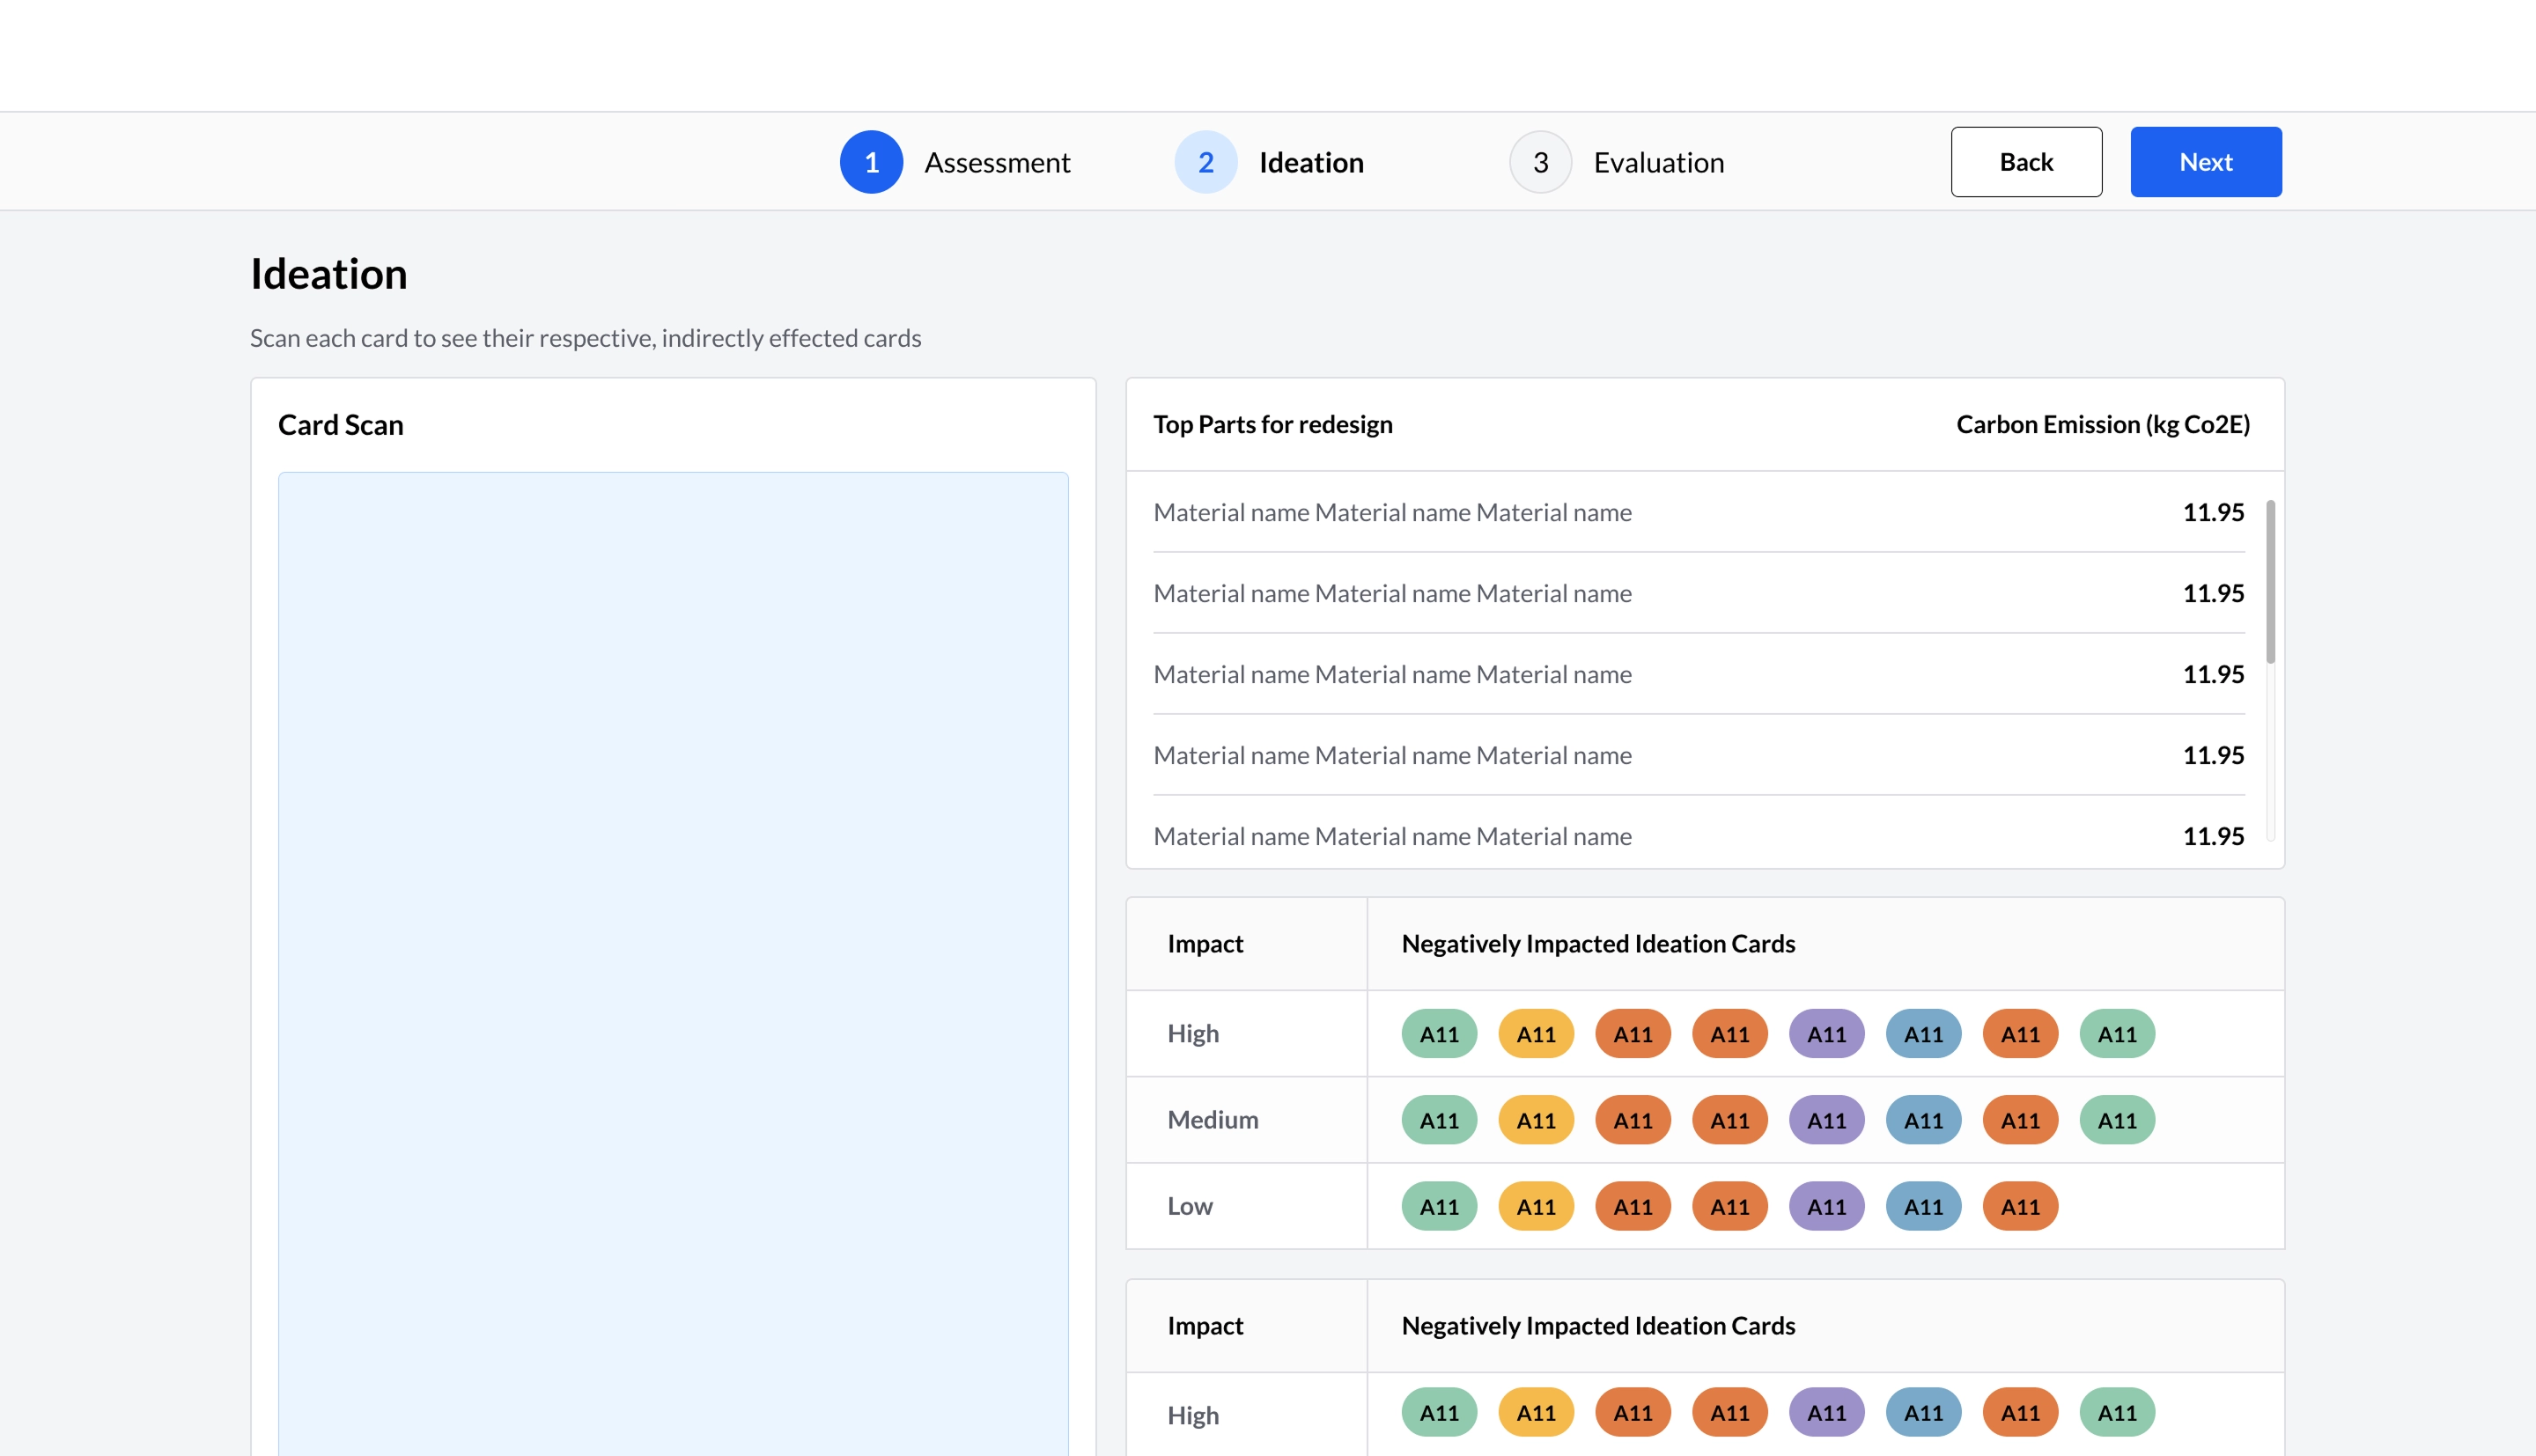
Ideation
AI powered features
- Step 1: Distribute
Cards are spread by color across the board, grouped by life cycle phase. - Step 2: Select
Teams choose ideation cards from decks to spark new ideas. - Step 3: Scan
Cards are scanned; the system highlights which areas “MUST” or “TRY” to be ideated upon, based on negative or positive impact.
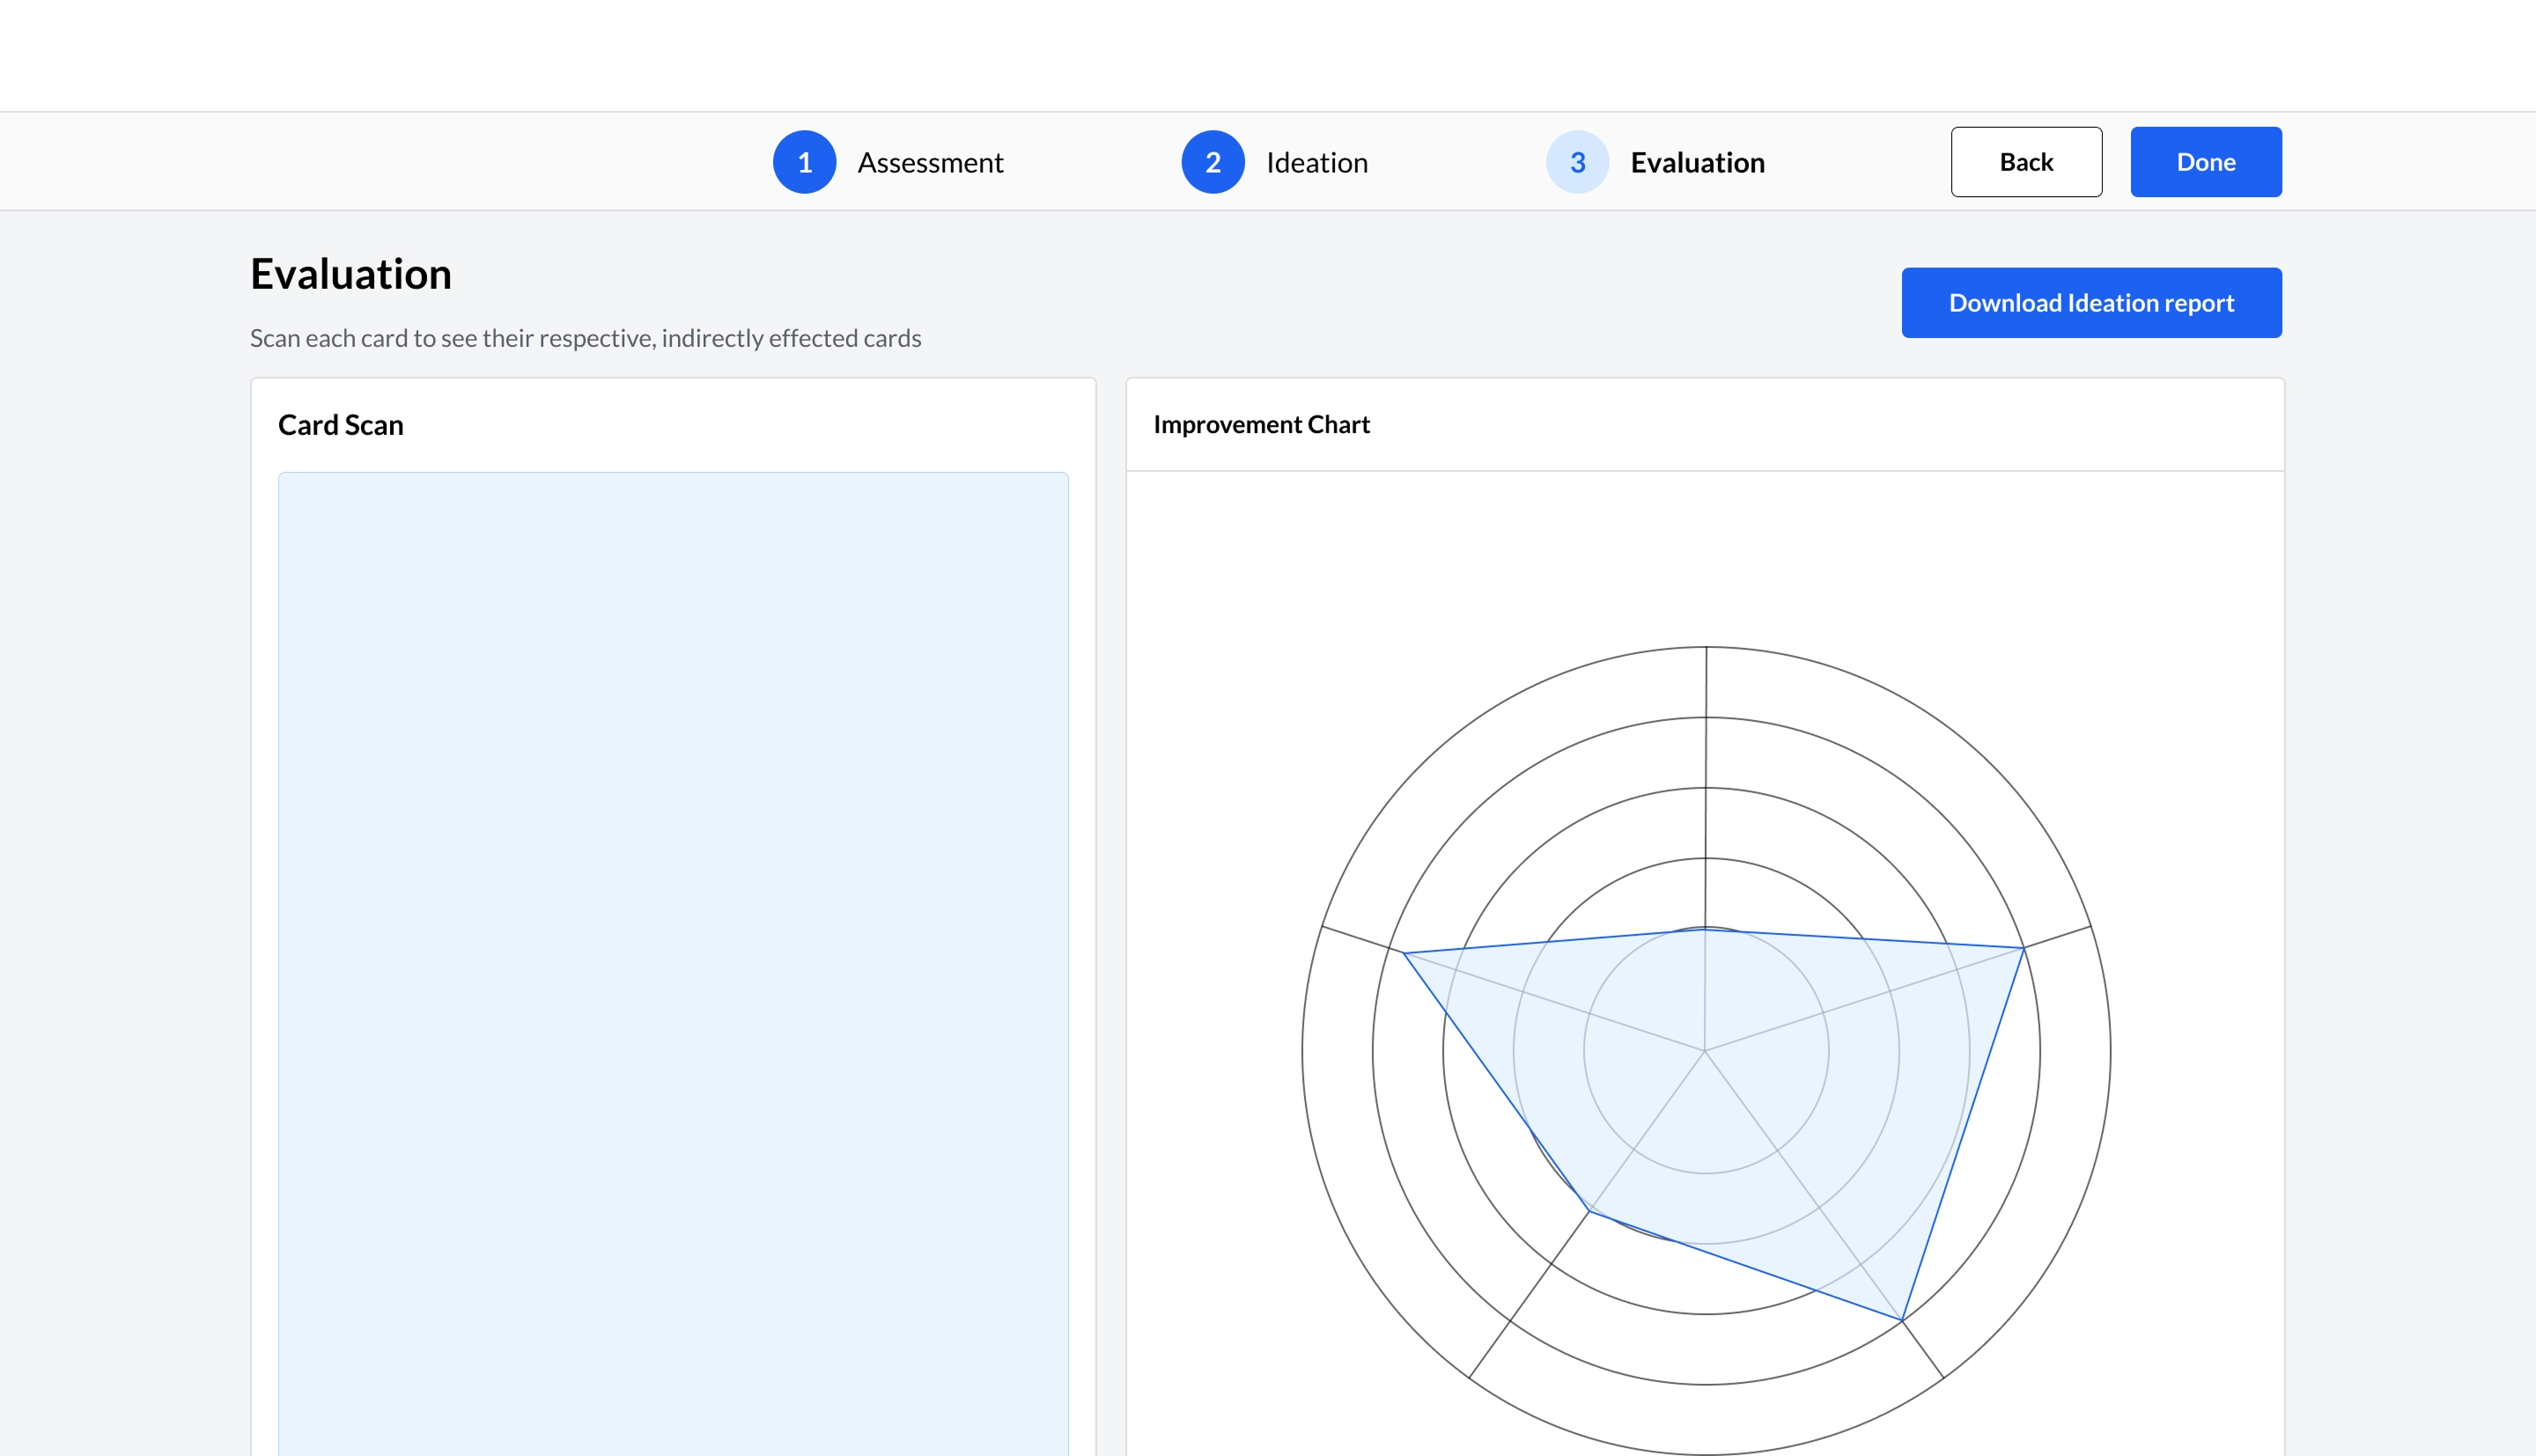
Evaluation
- Step 1: Sketched
Teams sketch ideas on cards based on cues. - Step 2: Rate
Ideas are rated using simple symbols:
++ Radical improvement
+ Incremental improvement
o None - Step 3: Results
The dashboard visualizes improvement levels and stores all ideas for embodiment design.
Project status
Project is Live
sustAInable is now fully deployed and operational. The dashboard and physical scanner system are being used by product design teams to assess and improve the sustainability of their products in real-world workshops.
Pilots will begin with early adopters.


